http://census.gov/content/dam/Census/library/publications/2015/econ/g13-aspef.pdf
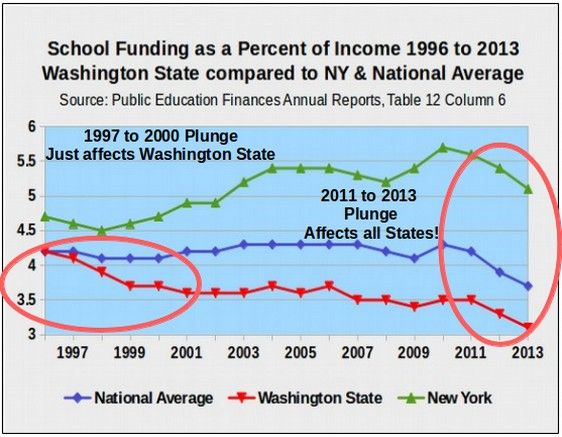
The above chart is based on Table 12, Column 6 of each of the annual reports since 1996. There are some rather startling things about this chart. First, it shows that Washington state school funding as a percent of income plunged rather dramatically between the years 2011 and 2013. This is despite a court order and a commitment by the legislature to increase school funding. As of 2013, Washington spent 3.1 percent of income on pubic schools. In 1996, Washington State spent 4.3 percent of income on public schools which is also about the national average (which is the blue line in the chart above). The difference between 3.1 percent and 4.3 percent is about one to two billion dollars per year. The above chart does not include school construction and repair funding like some of my past charts. Had this been included, the total national average spending would have risen to about 5% of income and the total difference between Washington state and the national average would be about $2 to $3 billion per year.
Add in the one billion per year that is unconstitutionally being spent on Basic Education by local school districts through local levies and the total State funding shortfall to comply with the Supreme Court order is $3 to $4 billion per year or $3,000 to $4,000 per pupil per year. (This is also the conclusion of the attorneys for the NEWS Coalition McLeary lawsuit). This is also about the cost to fully fund Initiative 1351 passed by the voters in 2014 and currently being ignored by the State legislature in 2015.
Why is the historical national average funding level of 4.3% important?
I want to be clear that when I am referring to national average school funding, I am not referring to the shockingly low level of national funding that occurred between2011 and 2013. 3.7 Percent is simply a sign that there is something deeply wrong with our entire nation right now. 4.3 Percent of income (or 5% of income when adding in school construction and repair funding) is important for several reasons. First, it is impossible to have national average class sizes without national average school funding. Smaller class sizes in turn are related to higher graduation rates because struggling students are more likely to get the help they need to pass courses. National average funding is important for another reason as students in Washington state will have to compete with students from other states to get into a good college. It is unfair to for our students to be subjected to some of the lowest school funding and highest class sizes in the nation as it will adversely affect their entire future. Finally, the historical national average reflects the combined wisdom of legislatures all across America over a period of many years. In fact, it had been a very stable measure until 2011 when it suddenly dropped from 4.3% of income to 3.7% of income. To understand how shocking this drop was, using Washington state as an average sized state, this drop would represent about one billion dollars per state. Multiple this times 50 states and the drop in just two years was close to $50 billion dollars per year in school funding that has been diverted to some other use and is no longer going to public schools.
How does Washington State School Funding Compare to a State with a Similar Economy?
Because Washington state has a stronger economy than most states, what is more appropriate than just the national average is to compare Washington state to an economically similar state such as New York. The difference between Washington state and the State of New York (the green line in the chart above) is about $8 billion per year – or $8,000 per pupil per year. All of this makes the $600 per pupil per year kicked in by the Washington State legislature this year look pretty pathetic. It does not even cover the cuts to school funding made in Washington state in recent years.
Look closely at the Washington state line (the red line in the chart above) and you will see two plunges. The first occurred between 1997 and 2000 and the second occurred between 2011 and 2013. In another article, we will discuss the 1997 to 2000 plunge (which was related to a 1997 tax break for the rich). Notice that the 1997 plunge happened only in Washington state and did not affect the rest of the nation or the state of New York which actually spent more on public schools at the same time Washington state was gutting funding for public schools.
Here, we will look at the most recent plunge in school funding as this plunge is likely still occurring. Look closely at the circle on the right side of the above chart and you will see that this new plunge in school funding is not just happening in Washington state. It is happening in the national average of all states and it is happening in New York. This means that there is a major national problem that began or got worse in about 2011.
Here is my explanation: The income of the super wealthy and major corporations has been skyrocketing since 2011 with record profits going to a few billionaires. But thanks to the billions of dollars in tax exemptions, these billionaires are not paying any taxes on all of this new wealth and therefore there is no money to fund the public schools. I will supply more evidence to support this theory in my next article showing that there has been a very sharp rise in the wealth of billionaires in the past few years. But first we need to understand how the above chart is different from other charts you may have seen on school funding here in Washington state.
Why Use “Percent of Income” for School Funding Rather than “Per Pupil Cost”
Billionaires and their political agents in Olympia love to fool us with charts showing that Per Pupil funding for public schools has gone up in Washington state almost every year. After all, it went up $600 per pupil this year. So there is no school funding problem right? Why is everyone complaining?
There are at least four major problems with using a simple Per Pupil chart to compare school funding from one year to the next or to compare school funding in one state to another state. First, Per Pupil funding completely ignores the rising cost of living and expenses such as food, transportation, health care and everything else from one year to the next. You can increase Per Pupil funding by 4% per year. But if the real inflation rate is 5% per year, then there was a one percent reduction in school funding not a four percent increase. This is just simple math. But apparently the legislature has a hard time understanding this – or maybe they just want to pretend that inflation does not exist.
Second, Per Pupil funding ignores the cost differences from one state to another state. The dollar goes a lot farther in states with a lower cost of living than it does in states with a higher cost of living.
Third, some states have a better economy than other states. States like Washington and New York have a better economy than other states because both of these states have major ports and a lot of wealthy people. It is easier to raise revenue in a state with a good economy and that is perhaps the most important reason to use Percent of Income (Table 12 in the annual education reports) rather than Per Pupil spending (Table 11 in the annual education reports).
Fourth, per pupil funding is not related to class sizes - but school funding as a percent of income is related to class sizes and class sizes are what really matter to the future of our students. For example, in the latest report, Washington state is 29th in the nation in school funding using the misleading “Per Pupil” funding. But Washington is 46th in the nation using the more accurate “Percent of Income” funding. According to the National Center for Education Statistics Schools and Staffing Survey (Table 8), Washington State has the third highest class sizes in the nation for elementary school, the second highest class sizes in the nation for middle school and the second highest class sizes in the nation for high school. http://nces.ed.gov/surveys/sass/tables/sass1112_2013314_t1s_007.asp
Only after doing the calculations as Percent of Income is it appropriate to convert the numbers to Per Pupil funding. As just one example, a difference of one percent of income converts roughly to one billion dollars per year in Washington state. (In New York, one percent of income would be a completely different number). Because Washington has one million students, one billion dollars per year converts into $1,000 per pupil per year.
This is a far more accurate method of telling how far Washington state is below the national average than just using Per Pupil costs which ignore all of the above factors. For example, Table 11 of the latest education funding report claims that national average Per Pupil funding is only $10,700 and Washington state Per Pupil funding $9,672 – only about $1,000 per pupil below the national average per pupil funding. This would lead to the erroneous conclusion that it would only take one billion dollars per year to restore school funding in Washington state to the national average.
At the same time, Per Pupil funding in New York is $19,818. School funding in Washington state is more than $10,000 per pupil less than school funding in a comparable state. It would take more than $10 billion per year (or $20 billion per biennium) to bring school funding in Washington state up to the same level as per pupil funding in New York state! This is why School funding as a Percent of Income is much more accurate than Per Pupil School Funding.
Why Current Education Spending is More Accurate than Education Revenue
Within Table 12 on the Education Funding reports, there are two options. You can use Column 1 which is “Education Revenue as a percent of income” – or you can use “Current Education Spending as a percent of income.” In the past, I have used Education Revenue. However, I now realize that was a mistake. The problem with revenue is that State legislatures and particularly the Washington state legislature has gotten very good at budget tricks to make it look like they are increasing school funding when in fact they are gutting school funding. For example, one trick was to transfer a couple hundred million dollars from the school construction account to the school operating budget account. They then claimed that they increased school funding by $200 million when it was really robbing Peter to pay Paul.
The revenue bait and switch games and creative accounting tricks have gotten so ridiculous in Olympia (and probably other state legislatures) that it became apparent that the only solution was to change my charts to Table 12 Column 6 – which is actual current school spending as a percent of income. This means the money that was actually spent on schools hiring teachers and buying books and all the other stuff that goes into a school. It is much harder to play games with the actual money because the actual money was actually spent and can be accounted for. This yields a slightly different chart than my past charts. But I think it will be more accurate moving forward. It will not matter what crazy games the legislature tries to pull. We will simply track the amount of money schools actually spend in the current year.
This is all we have time for in this report. In my next article, I will explain why school funding in Washington state plunged by billions of dollars per year between 1997 to 2002 and how Senate Bill 6093 can help us get these billions of dollars per year back simply be altering a 1997 tax break for the rich. Below are the links to the reports that were used to create the graph in this article.
Regards,
David Spring M. ED.
Director Coalition to Protect our Public Schools
spring for schools (at) aol (dot) com
LINKS:
Public Education Finances 2013 was released on June 2 2015
http://census.gov/content/dam/Census/library/publications/2015/econ/g13-aspef.pdf
Public Education Finances 2012 was released on June 1 2014
http://census.gov/content/dam/Census/library/publications/2014/econ/g12-cg-aspef.pdf
Public Education Finances 2011 was released on June 1 2013
http://census.gov/content/dam/Census/library/publications/2013/econ/g11-aspef.pdf
Public Education Finances 2010 was released on June 1 2012
http://www2.census.gov/govs/school/10f33pub.pdf
Public Education Finances 2009 was released on June 1 2011
http://www2.census.gov/govs/school/09f33pub.pdf
Public Education Finances 2008 was released on June 1 2010
http://www2.census.gov/govs/school/08f33pub.pdf
Public Education Finances 2007 was released on May 2009
http://www2.census.gov/govs/school/07f33pub.pdf
Public Education Finances 2006 was issued on April 2008
http://www2.census.gov/govs/school/06f33pub.pdf
Public Education Finances 2005 was issued on April 2007
http://www2.census.gov/govs/school/05f33pub.pdf
Public Education Finances 2004 was issued on April 2006
http://www2.census.gov/govs/school/04f33pub.pdf
Public Education Finances 2003 was issued on March 2005
http://www2.census.gov/govs/school/03f33pub.pdf
Public Education Finances 2002 was issued on April 2004
http://www2.census.gov/govs/school/02f33pub.pdf
Public Education Finances 2001 was issued on April 2003
http://www2.census.gov/govs/school/01fullreport.pdf
Public Education Finances 2000 was issued on April 2002
http://www2.census.gov/govs/school/00fullreport.pdf
Public Education Finances 1999 was issued on April 2001
http://www2.census.gov/govs/school/99tables.pdf
Public Education Finances 1998 was issued on April 2000
http://www2.census.gov/govs/school/98tables.pdf
Public Education Finances 1997 was issued on April 1999
http://www.census.gov/prod/gc97/gc974-1.pdf
Public Education Finances 1996 was issued on April 1998
http://www2.census.gov/govs/school/96tables.pdf