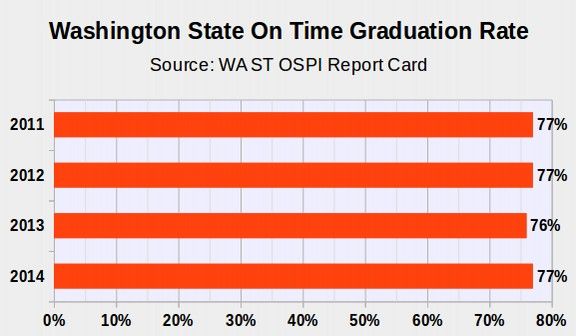
The High School Graduation Rate in Washington State has not increased in several years
Go to the Washington State OSPI website and click on Research, then School Report Card. While it opens to a page that claims to be about the Class of 2015, the 4 year statewide graduation rate is about the class of 2014 and is listed as 77%. Select the Previous year and click Go and you will see that the statewide graduation rate for the Class of 2013 was 76%. The Class of 2012 was 77% and the Class of 2011 was 77%. Put bluntly, there has not been a significant improvement in the graduation rate here in Washington state in several years. Here is the direct link:
http://reportcard.ospi.k12.wa.us/summary.aspx?groupLevel=District&schoolId=1&reportLevel=State&year=2014-15
The Reason the High School Graduation Rate has not increased is that the State legislature has gutted funding for public schools – preventing struggling high school students from getting the help they need to complete their courses
The lack of progress in improving the graduation rate in Washington state is understandable given that our state legislature has gutted funding for public schools during the past 20 years in order to give billions in tax breaks to Boeing, Microsoft and other wealthy multinational corporations.
The low graduation rate in Washington state is not the fault of students, teachers, parents, schools or school districts. It is the fault of a state legislature that is so corrupt that it is essentially owned by wealthy multinational corporations and cares more about giving tax breaks to the rich than funding our public schools.
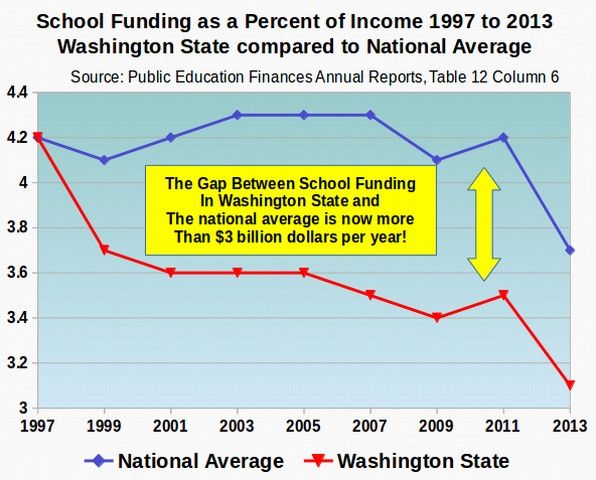
As a result of massive tax breaks to wealthy corporations, Washington state now has among the lowest school funding in the nation as a percent of income and among the highest class sizes in the nation. For Grades 1 through 6, the national average class size is 21 students and the average class size in Washington state is 24 students.
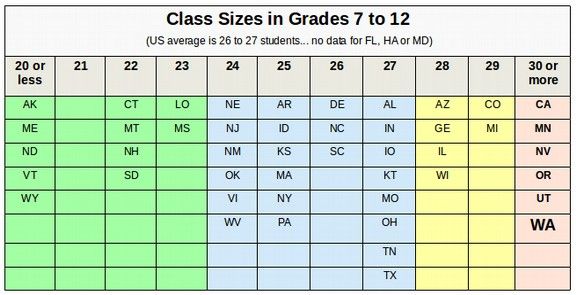
For Grades 7 through 12, the national average class size is 27 students and the average class size in Washington state is 30 students.http://nces.ed.gov/programs/digest/d13/tables/dt13_209.30.asp
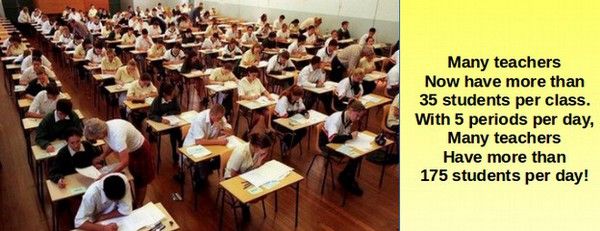
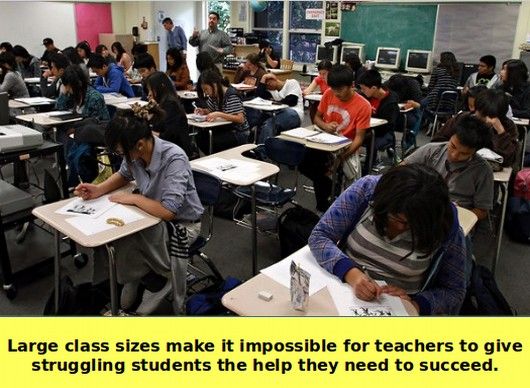
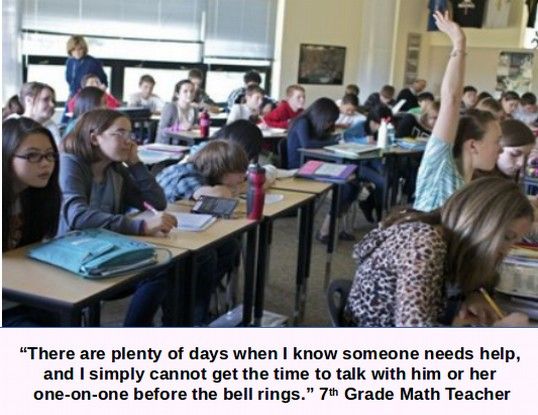
It is impossible to increase the graduation rate when class sizes are so large that struggling students do not get the help they need to complete their courses.

This is why the Washington State Supreme Court has ruled that the State legislature is in “contempt of court.” It is contrary to our state constitution for the legislature to rob billions of dollars from our public schools in order to line the pockets of the corporations and billionaires that paid for their elections.
Despite the fact that the graduation rate in our state has not improved in several years, some school district administrators in Washington state have recently claimed that they have miraculously raised the graduation rate in their school district.
For example, on December 10, 2015, administrators of the Tacoma School District announced that they had raised their graduation rate from a 55% for the Class of 2010 to an amazing 82.6% - an increase of 27% in just 5 years! http://www.tacoma.k12.wa.us/Pages/default.aspx
Sadly, while it would be wonderful if more students were graduating from the Tacoma School district, OSPI actual enrollment and graduation reports show that there has been no increase in the graduation rate in the Tacoma school district! Instead, like several other school districts (but not all school districts), the Tacoma School District has used a series of reporting scams to hide struggling students from their OSPI Graduation reports in order to artificially inflate the graduation rate in their school district. Because the Devil is in the Details, let's look more closely at how these cheating school districts are misleading the public.
Greatly Under Reporting the Number of 9th Graders
The on time graduation rate should be simple to determine. Just take the number of graduates in any given year and divide it by the number of 9th graders who started high school 4 years earlier. The latest graduating class analysis posted at OSPI is for the Class of 2014 so we will use that class for our analysis. The graduating class of 2014 were Seniors in the fall of 2013, Juniors in the fall of 2012, Sophomores in the fall of 2011 and 9th graders in the fall of 2010.
How OSPI Hides 9th Graders
We noted above that the OSPI Statewide Report Card for the past 4 years shows an on time graduation rate of about 77%. However, these graduation rates were based on an average claimed 9th grade cohort of about 79,000 students. The actual 9th grade cohort as averages about 86,000 students meaning that about 7,000 students per year or almost one in ten high school students has somehow been "hidden" and is not being reported!
| Year – Class of |
Actual # of Graduates |
Claimed 9th Grade Cohort |
Reported Graduation Rate |
Actual 9th Grade Cohort |
Actual Graduation Rate |
| 2011 |
61,550 |
81,680 |
77 |
88,232 |
70 |
| 2012 |
60,345 |
78,458 |
77 |
86,576 |
70 |
| 2013 |
60,170 |
79,528 |
76 |
86,382 |
70 |
| 2014 |
60,680 |
78,556 |
77 |
84,868 |
71 |
Sources: Number of Graduates and Claimed Cohort from OSPI Annual Graduation Reports; Actual 9th Grade Cohort per OSPI 1251 enrollment reports...Class of 2014 = 2010 Report, Class of 2013 = 2009 Report, Class of 2012 = 2008 Report, Class of 2011 = 2007 Report
How are these 7,000 students per year being hidden and not counted? To see how this is done, we will look at a series of school districts beginning with the worst student hiding school district - the Tacoma School District.
How the Tacoma School District Hides 9th Graders
In October 2010, according to OSPI report 1051, there were 2,707 9th graders attending school in the Tacoma School District. http://www.k12.wa.us/safs/rep/enr/1011/s1251.pdf
The Tacoma school district website enrollment for October 2010 listed 2,678 9th graders in October 2010 for a difference of only 31 students. In June 2014, according to the OSPI latest report, 1,464 students graduated from the Tacoma School District. This makes the on time graduation rate in the Tacoma School District 1464 graduates /2707 9th graders = 54%. Using the school district enrollment of 2,678, the graduation rate was 1464/2678 = 55%. In other words, the actual graduation rate in the Tacoma School District in 2014 was only 54% to 55% - the same as it was in 2010!
Yet in December 2014, the Tacoma School District issued a press release claiming that the graduation rate in the Tacoma School District was 78%. How did they get from an actual rate of 55% to a reported rate of 78%? To see how this is done, go to the OSPI website and click on Research, then Data and Reports, then Dropout and Graduation. Here is the direct link to this OSPI page:
http://k12.wa.us/DataAdmin/default.aspx#dropoutgrad
You will see several confusing reports for each year:
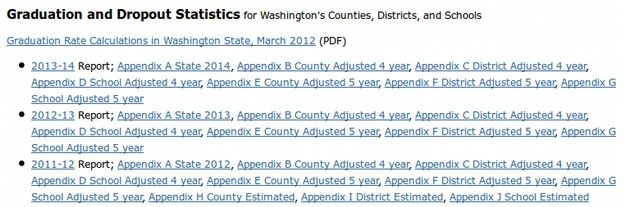
What we want is the most recent school district reports. This is 2013-14 Appendix C District Adjusted 4 year. Click on the link to download the Excel spreadsheet. Then open the spreadsheet and scroll down the page to the Tacoma School District. Here is what you will see:
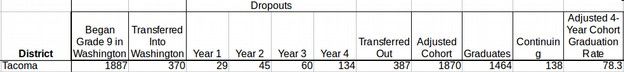
Note that the Tacoma School District administrators claim that only 1887 students began the 9th grade in the Tacoma School District in 2010! This is over 800 students less than were listed on the 9th grade OSPI attendance report in October 2011. After adjusting for 17 more transfer outs versus transfer ins and the adjusted claimed 9th grade cohort dropped down to only 1870 students. 1464 students graduated and thus the claimed graduation rate was 1464/1870 = 78%.
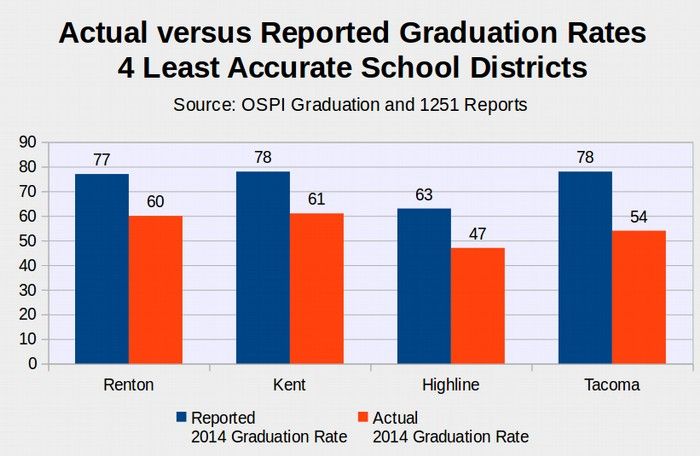
Sadly, the Tacoma School District is not the only school district using this reporting scam to artificially inflate their graduation rates. Seven of the 20 largest school districts under reported the number of 9th graders on the 2013-2014 OSPI graduation report by more than 10% of the actual total. The least honest school district was Tacoma which under reported the number of 9th graders by 27%. The next least honest was Kent at 24%. Seattle and Renton tied for third least honest at 18%. Below is a comparison of the 30 largest school districts of number 9th graders on OSPI report for 2010 versus 2014 graduation report.
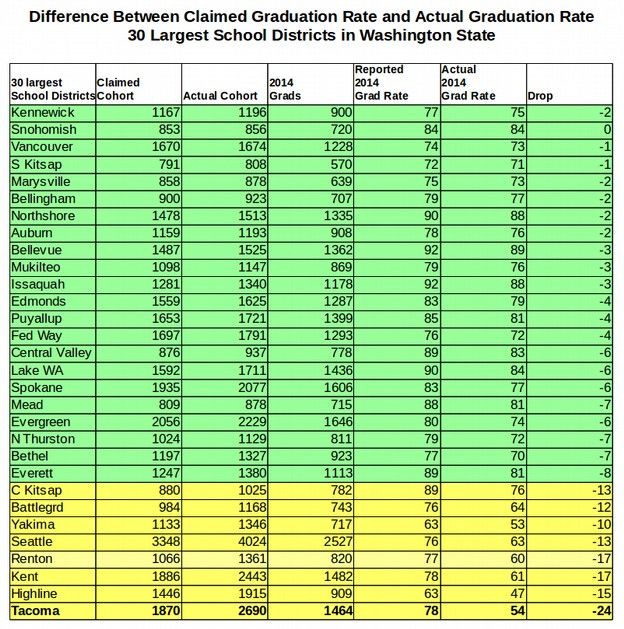
Sources: Actual 9th Graders from OSPI Report 1251 (2011). Rest of data from OSPI Graduation Report 2013 2014 Appendix C. Pasco and Richland excluded due to reporting errors.
On a positive note, 80% of the 40 largest school districts reported close to their actual number of 9th graders.
Below is a graph of the difference between the reported graduation rate and the actual graduation rate for the four least honest school districts:
The Struggling Student Shell Game
Now that we understand that only some school districts are hiding students, we will take a closer look at how this struggling student shell game works. In conversations with OSPI administrators about this problem, they dismissed it by claiming that the Tacoma School District simply had a "high mobility rate." The problem with this claim is that the 2014 OSPI Graduation Report confirms that the Tacoma School District only had 17 more students transfer out than transfer in. So mobility only accounts for 17 students out of the missing 722 students. Where did the other 700 Tacoma School District 9th graders go?
The answer is that they went to "Alternative Learning Experience (ALE) Programs" - mainly the K12 INC online program ran by the Quilcene School District in Forks Washington. These ALE programs are being used by several school districts to hide struggling students and "get them off of the school district book." Once these struggling students transfer to another school district, they are no longer counted as part of the Tacoma School District Cohort. But also, they are not counted as part of the Quilcene School District Cohort because they did not start the 9th grade in the Quilcene School District. These struggling students become invisible - even though all of them are still living in the Tacoma School District! Even the office for the Quilcene K12 INC online program is located in Tacoma! The graduation rate for the K12 INC program is only 30%. But it is not counted in any way as a part of the Tacoma School District graduation rate or even the Washington State Graduation rate. The kids are invisible due to a "loophole" in the State Graduation Rate formula that not only allows this scam but encourages it
How the Struggling Student Shell Game was Created
Here is the language in from the OSPI Report Card website used to justify the struggling student shell game:
"Actual Adjusted 4-Year (On-Time) Cohort Graduation Rate (Class of 2013) – The total number of students identified in grade 9 as belonging to the Class of 2013 (during the 2009-10 school year) who are reported as graduates, divided by the total number of students identified as the Class of 2013, during the 2012-13 school year. Students who enrolled at any time prior to the end of the 2012-13 school year, identified as belonging to the Class of 2013, are included in the calculations. Students identified as belonging to the Class of 2013 who have exited with a confirmed transfer... are removed from the calculations. "
The loophole is "exited with a confirmed transfer." What it really should say is "confirmed to have moved out of the school district." Otherwise transfers can and do occur to ALE programs even when the student remains in the school district.
Here is what the federal law actually says:
"As defined in 34 C.F.R. §200.19(b)(1)(i)-(iv), the four-year adjusted cohort graduation rate (hereafter referred to as “the four-year graduation rate”) is the number of students who graduate in four years with a regular high school diploma divided by the number of students who form the adjusted cohort for the graduating class. From the beginning of 9th grade, students who are entering that grade for the first time form a cohort that is subsequently “adjusted” by adding any students who transfer into the cohort later during the 9th grade and the next three years and subtracting any students who transfer out, emigrate to another country, or die during that same period."
More information about the actual adjusted cohort calculations can be found at http://www2.ed.gov/policy/elsec/guid/hsgrguidance.pdf.
The above report goes on to explain that the graduation rate must include ALL students in the 9th grade cohort, even including special education students.
See the difference? Federal law refers to transfers as in students transferring out of the school district or out of the state while OSPI merely refers to "exited with a confirmed transfer" which OSPI and the Tacoma School District have interpreted to mean transferring to an ALE program in another school district even if the student continues to legally reside in the same school.
Federal law is not written in terms of school districts but simply in terms of "schools." One might therefore argue that when a student changes from the Tacoma School District to the K12 INC program in the Quilcene School District that they are no longer in the Tacoma School District and should be counted against the graduation rate in the Quilcene School District. In fact, such students are not counted in the Graduation Rate for either school district. Also in fact, the students still live legally in the Tacoma School District. Even the K12 INC head office is in the Tacoma School District. The intent of the federal law was a complete and accurate accounting of all students. Therefore the OSPI interpretation and the loophole it creates are something being done by OSPI not by any federal regulation. The above report makes it clear that every student should be counted. Washington law reports graduation rates by school district. Every student in every school district should be accurately counted in terms of where they actually live.
What about the section of federal law that allows for transfers to include transfers to "other programs?"
The above report explains that students may be considered to have transferred out (of the school or school district) if the student transfers to a private school or a home school program or to "other educational programs" that lead to a high school diploma. But the report also makes clear that the state record keeping must be complete and accurate. It is not appropriate for OSPI to create a black hole where 7,000 students per year are simply not counted in order to artificially increase the graduation rate in a particular school district or the state as a whole. OSPI record keeping is neither complete or accurate.
Red Flags Ignored by OSPI...
There have been several red flags ignored by OSPI. Here are a couple.
Major Declines in Middle School and Elementary School Enrollment
There are a series of "red flags" that should have been a clue to OSPI that some sort of scam was occurring in the Tacoma School district. For example, some school districts such as the Tacoma School District have substantially fewer students in each grade in high school than they do in middle school or elementary school. This should not be the case and questions need to be asked but were not about where all of these students went.
Major Declines in High School Enrollment over Time
Another major red flag is a decline in the school district high school enrollment over time. The total enrollment of students in Washington state is going up slightly over time. So one has to ask why the enrollment would decline in any given school district. Below is the number of 9th graders in the Tacoma School District from 2010 to 2015 October enrollments per OSPI Report 1251.
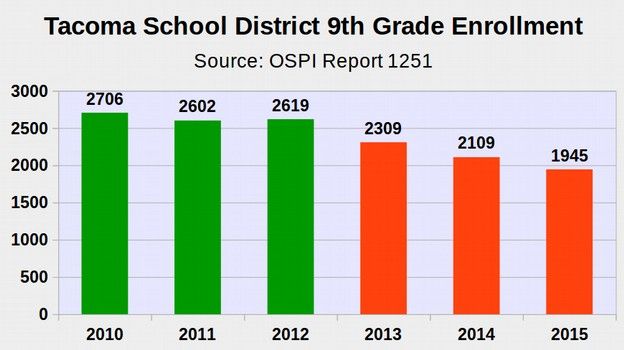
Something major happened in the Tacoma School District between 2012 and 2013 because there has been a huge unexplained decline in high school enrollment of about 700 students per grade since 2012. Where did these 700 students per year go?
Starting Up Special Programs to use as Dumping Grounds for Struggling Kids?
Some claim that special programs such as the Willie Stewart Academy, which opened during the 2013-14 school year, artificially pump up graduation rates by moving some of Tacoma’s most struggling students out of mainstream schools into programs not counted by OSPI. Willie Stewart Academy has a total of about 200 students. To better evaluate this claim, go to the OSPI report card and select the Tacoma School District. Then select the Willie Stewart Academy. You will see that it was closed on July 31 2015. Before that, it has an enrollment of 200 students and a graduation rate of 2 percent. No wonder it was closed. Tacoma also has the Fresh Start program with 200 students and a graduation rate of 15%. They also had a GED program which closed in July of 2015 which had 42 students but did not appear to have any graduates. There is also Oakland high school with 200 students and a graduation rate of 15%. So there appears to be several programs that are used as dumping grounds for struggling students in Tacoma. It is not clear how many of these programs are counted in Tacoma's graduation rate.
Why the Washington State Graduation Rate is about to Decline Dramatically
Not only has the state legislature refused to fully fund our public schools, but they have been quietly increase the graduation requirements during the past several years. First, they have increased the number of credits needed to graduate from 19 credits to 24 credits. This means that in many school district, any student who fails even a single class during their four years of high school will not be able to graduate. Second, some requirements have been raised dramatically. Some students will be required to take four years of advanced math courses to graduate. Third, the new SBAC tests are extremely unfair with only 20% to 30% of students able to pass these tests that will be required for graduation beginning with the class of 2017. As many as 50,000 students per year may be denied a high school diploma simply because they failed one of these tests that are so difficult that few members of the state legislature could even pass them.

What is the solution to the Struggling Student Shell Game?
I have proposed a bill that would continue to count every student in every school district as being part of the grade cohort for that school district unless and until the student physically moves out of the school district and into another school district. We will keep you posted as to whether this bill actually gets a hearing.
Here is the text of our bill, called the Accurate High School Graduation Rate Act of 2016:
AN ACT Relating to improving the completeness and accuracy of graduation rate reports; amending RCW 28A.175.010; and creating new sections.
BE IT ENACTED BY THE LEGISLATURE OF THE STATE OF WASHINGTON:
NEW SECTION. Sec. 1. The legislature finds that:
(a) There is a loophole in current Washington State law that results in thousands of students not being counted in the graduation rates of schools and school districts after having transferred to "Alternative Learning Experiences" even though these students still reside in the school district which no longer counts them.
(b) These students also might not be counted by the receiving school district.
(c) Many of the Alternative Learning Experience programs have an extremely low graduation rate... a rate that is often only half of the state average graduation rate.
(d) Parents and concerned citizens are mis-informed by not being provided with an accurate and complete graduation rate for their school district.
(e) Parents and concerned citizens are also mis-informed by not being provided with an accurate and complete graduation rate for alternative learning experiences.
(f) Schools and school districts currently have an incentive to push struggling students into alternative learning experiences in order to artificially inflate their published graduation rates.
(g) The legislature therefore intends to provide clarifying language to make it clear that every school district must count every student and to remove the incentive for school districts to dump struggling students into alternative learning experience programs.
Sec. 2. RCW 28A.175.010 is amended to read as follows:
Educational progress information—Reporting requirements—Rules—Reports to legislature—Annual estimate of savings.
Each school district shall account for the educational progress of each of its students. To achieve this, school districts shall be required to report annually to the superintendent of public instruction:
(1) For students enrolled in each of a school district's high school programs:
(a) The number of students who graduate in fewer than four years;
(b) The number of students who graduate in four years;
(c) The number of students who remain in school for more than four years but who eventually graduate and the number of students who remain in school for more than four years but do not graduate;
(d) The number of students who transfer to other schools outside of the school district. Students who enroll in alternative learning experiences in or out of a school district but continue to legally reside in the school district shall continue to be counted as part of the school district and school district grade cohort for purposes of determining the on time and extended graduation rates ;
(e) The number of students in the ninth through twelfth grade who drop out of school over a four-year period; and
(f) The number of students whose status is unknown.
(2) Dropout rates of students in each of the grades seven through twelve.
(3) Dropout rates for student populations in each of the grades seven through twelve by:
(a) Ethnicity;
(b) Gender;
(c) Socioeconomic status;
(d) Disability status; and
(e) Identified homeless status.
(4) The causes or reasons, or both, attributed to students for having dropped out of school in grades seven through twelve.
(5) The superintendent of public instruction shall adopt rules under chapter 34.05 RCW to assure uniformity in the information districts are required to report under subsections (1) through (4) of this section. In developing rules, the superintendent of public instruction shall consult with school districts, including administrative and counseling personnel, with regard to the methods through which information is to be collected and reported in a manner which is complete, accurate and accounts for each and every student.
(6) In reporting on the causes or reasons, or both, attributed to students for having dropped out of school, school building officials shall, to the extent reasonably practical, obtain such information directly from students. In lieu of obtaining such information directly from students, building principals and counselors shall identify the causes or reasons, or both, based on their professional judgment.
(7) The superintendent of public instruction shall report annually to the legislature the information collected under subsections (1) through (4) of this section.
(8) The Washington state institute for public policy shall calculate an annual estimate of the savings resulting from any change compared to the prior school year in the extended graduation rate. The superintendent shall include the estimate from the institute in an appendix of the report required under subsection (7) of this section, beginning with the 2010 report.
Conclusion... We Must End the Struggling Student Shell Game
What is clear is from this report is that there is no turn around miracle going on in the Tacoma School District or any other school district in Washington state. Students need more than pep talks and toxic high stakes tests. Struggling students need small class sizes beginning in the early grades so that they can get the help they need from experienced teachers. It would take more than $3 billion per year in additional state funding just to lower class sizes in Washington state back down to the national average. The only bill that has been introduced into the legislature that would provide this $3 billion per year is Senate Bill 6093 – which would repeal a tax break used by billionaires to avoid paying their fair share of state taxes. So far, this bill has not even gotten a hearing.

So what is the solution to the lack of school funding in Washington state?
We cannot solve the school funding problem by constantly re-electing the same corrupt people who created the problem. It will either take more action by the Supreme Court or it will take parents and teachers willing to run for office and replace the current batch of people in Olympia with a different group of people that will actually take their paramount duty to fund the public schools seriously. Only then will we see a real reduction in class sizes and a real increase in the high school graduation rate here in Washington state.
As always, I welcome your questions and comments.
Regards,
David Spring M. Ed.
Coalition to Protect our Public Schools (dot) org.