Latest News

In this category, we will post the latest news on the crimes committed by billionaires and how the public is starting to wake up and fight back. 

01

Meet the New Washington School Assessment Scam


In this article, we will explain why the new Washington State School Assessment System is even more ridiculous than the old School Assessment System. For example, 40% of the schools that the new school assessment systems honors for “reducing the achievement gap” actually had an increase in the achievement gap. The new system also gave awards to schools where not a single student was able to meet either the state Math standard or state English standard. In addition, the new system gave awards to schools with an 8 percent graduation rate and a 92 percent drop out rate. It’s only a matter of time before OSPI is passing out a Certificate of Excellence to Sharky’s School of Gambling.


The new school assessment scam is an insult to every teacher, parent and student in Washington state. Please share this important article with other parents and teachers. It is time for parents and teachers to rise up and put an end to the new Washington State School Assessment Scam.

Every year in Washington State, every school is assessed and compared to each other based on student performance. In 2018, OSPI created a new assessment system which added a few extra factors, like attendance and the number of AP courses and dual-credit courses students take. OSPI also added a new factor which OSPI claimed could measure how much a given school had “lowered the achievement gap” - or the difference in test scores between rich kids and poor kids from one year to the next. On May 20 2019, OSPI announced the results of this new system for ranking schools. 216 schools out of about 2000 schools were recognized with an award. Unfortunately, 40 percent of the schools given an award for reducing the Achievement Gap from 2018 to 2019 actual had an INCREASE in the Achievement Gap from 2018 to 2019. http://sbe.wa.gov/our-work/accountability/2017-2018-state-recognized-schools

Why is there an Achievement Gap? 60 Years of Scams and Snake Oil
The Achievement Gap is loosely defined as the difference in test scores on unreliable and invalid high stakes tests (such as SBAC) between a group of higher income students and a group of disadvantaged students - those students who get free or reduced price lunch. The term Achievement Gap comes from grossly inept analysis of low income students back in 1966 called the Coleman Report.


Historically, hundreds of attempts claiming to reduce the Achievement Gap during the past 60 years has failed in every state in the US. In fact, in recent years, the achievement gap has increased as the US population has split into the super rich versus the super poor. Here is a quote from a 2011 Stanford University study: “As the income gap between high- and low-income families has widened, the achievement gap between children in high- and low-income families has also widened. The achievement gap between children from high- and low income families is roughly 30 to 40 percent larger among children born in 2001 than among those born twenty-five years earlier. The relationship between income and achievement has grown sharply… a given difference in family incomes now corresponds to a 30 to 60 percent larger difference in achievement than it did for children born in the 1970s…” https://cepa.stanford.edu/sites/default/files/reardon%20whither%20opportunity%20-%20chapter%205.pdf

Most studies that analyze the Achievement gap report the gap in units of standard deviation. A gap of 1 standard deviation is very large, about 4 years of learning in middle or high school. A gap increase of 0.1 standard deviations is about the same as 4 months of learning.

The following chart is from a series of national tests, such as NAEP, for birth years from 1954 to 2004. The 90 10 gap means the difference in test scores of a student in the top ten percent of income minus the test score of a student in the bottom 10% of income.

01

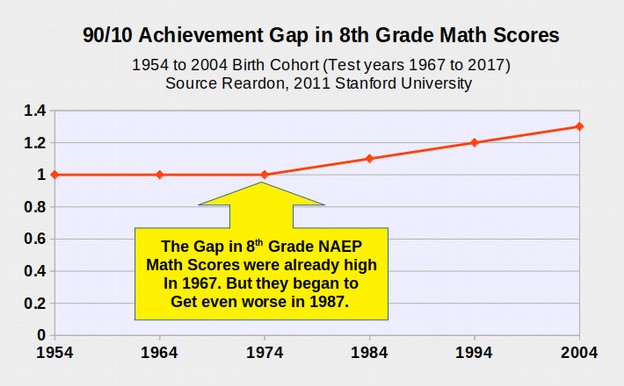
Put in plain English, the difference between very rich and very poor students was about 4 years of learning up until about 1987. Since then, it has grown to about 5 years of learning (1.3 standard deviations).

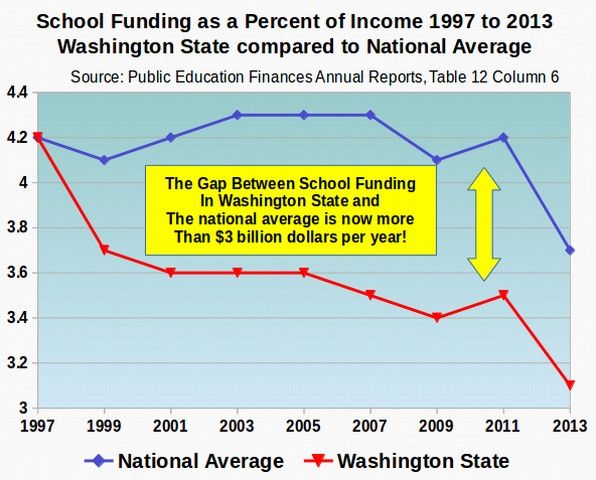
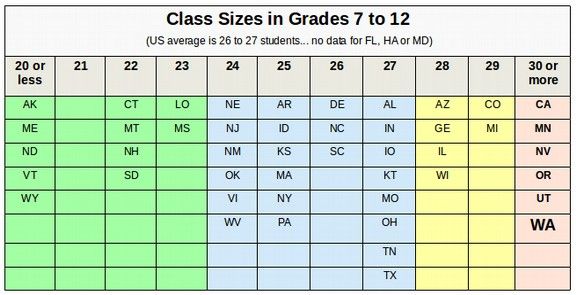
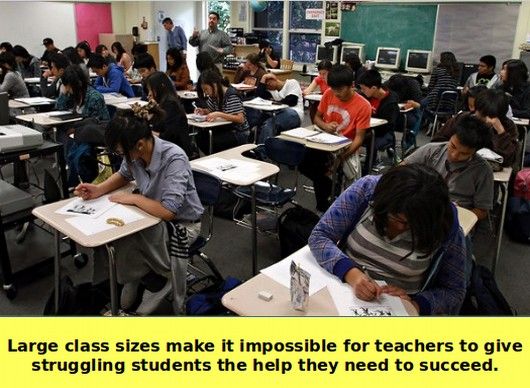
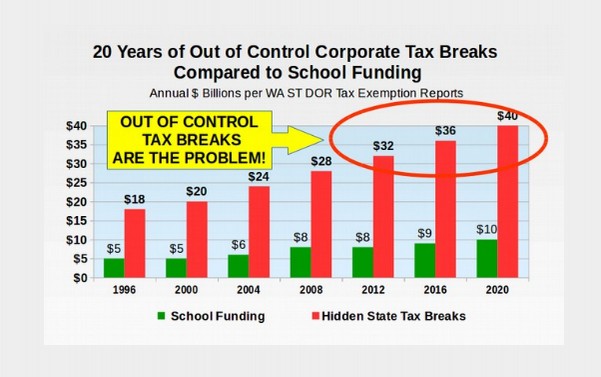
As the once middle class has fallen into poverty, so have the test scores of their students. It is poverty that creates the Achievement Gap. The only scientifically proven ways to reduce the achievement gap are to lower class sizes (so struggling students get the help they need) and/or increase the income of their parents (so struggling students are not forced to deal with the additional stress of poverty). Since the Washington legislature has gutted funding for public schools in order to give more tax breaks for the rich - thereby increased class sizes over the past 20 years, to among the highest class sizes in the nation - they have shown that they are not really interested in reducing class sizes.

But instead of advocating for fewer tax breaks breaks for the rich and lower class sizes, the new OSPI School Assessment Plan uses random fluctuation in unreliable SBAC test scores to give awards to schools who had a slight reduction in the difference between test scores of the rich versus the poor as a way to honor some schools over other schools.

However, the new system is just as absurd as the old system. The problem is that the primary method used to evaluate schools, the SBAC test, is a deeply flawed test that has never been shown to be either reliable or valid. It is like trying to build a house on a foundation of sand. It is certain to lead to unfairness and disaster.

Because this new system ignores the real problem of poverty, just like the old system did, and because it relies primarily on the unstable SBAC test, it is likely that schools that reduce the Achievement Gap one year will not be able to further reduce the Achievement Gap the next year. In fact, a statistical law called Regression to the Mean predicts that their Achievement Gap scores will go back up. We will therefore examine some of the results from this years group of 216 schools to better understand the ridiculousness of the new school assessment method being used by OSPI.

First, the new school ranking system is based on the new Washington School Improvement Framework (WSIF) which in turn is based on the Washington State plan submitted to the US Department of Education in accordance with the new federal ESSA plan which replaced the failed and disgraceful NCLB federal plan. Ten years from now, I predict there will be a new federal plan to replace the failed and disgraceful ESSA plan. Then there will be a new state assessment system – and the charade of pretending to help students while doing nothing about the real problems our students face will continue until parents and teachers finally stand up and demand real help in the form of smaller class sizes for struggling low income students.

Here is a link to the new Washington State Improvement Plan released on March 15 2018: http://sbe.wa.gov/news/washington-releases-new-school-improvement-framework

The two primary goals of the Washington state plan are:

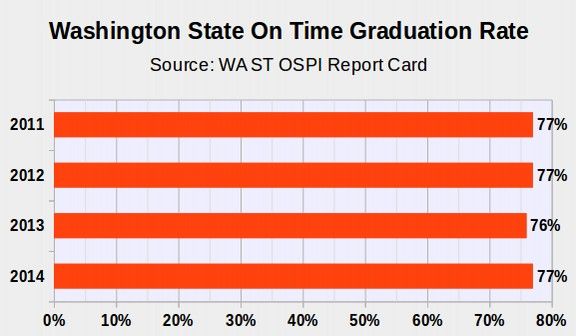
By 2026-27, the long-term goals are 90 percent proficiency in English/language arts and math, and a 90 percent graduation rate.

Here is what the claimed Math improvement will be during the next 10 years (from 2017 to 2027):

02

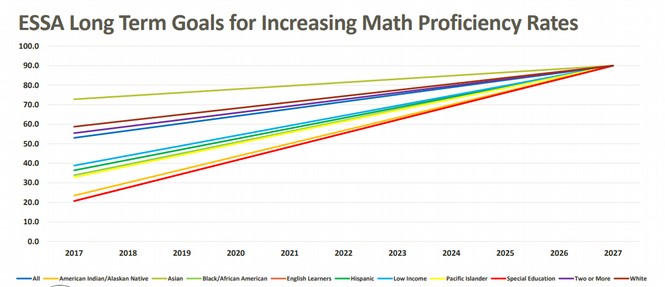
The above graph looks exactly like the old NCLB graphs of 15 years ago which claimed that 100% of students would be Proficient in Math in 10 years. In fact, NCLB led to a reduction in the number of students who were proficient in Math! There is no chance of achieving the 90% proficiency goal as long as Washington state students continue to be subjected to the highest class sizes in the nation.

Here is a table claiming that the new Accountability System will magically improve the graduation rate to 90% for all students in the next 10 years.

03

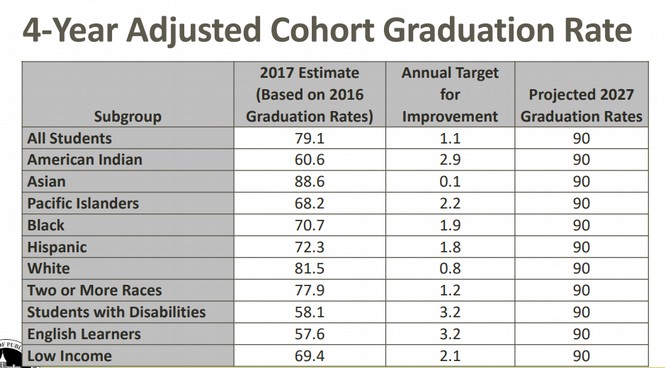
There is no chance of achieving a 90% graduation rate as long as Washington state students are subjected to among the highest class sizes in the nation and so many families are living in poverty.

Deciphering the Decile Rating System
The new school rating system for Washington state now divides schools into ten groups called deciles (1 to 10 scale). Washington state is the only state in the nation using this complex 1 to 10 decile scale. This is because very few parents will be able to understand it. Other states use an A to F division or a 100 point index or a one to four or five stars – as if schools were like a hotel. Some states like California, Oregon, Idaho and Pennsylvania use color codes for individual factors but not assign any over-all school rating.


The Old Washington Achievement Index was based on a weighted combination of measures scored on a scale from 1 to 10. The new Washington Accountability System is also on a scale from 1 to 10 - but each of five variable is scored on a decile distribution. These five individual scores are weighted using a complex formula for the combined score.

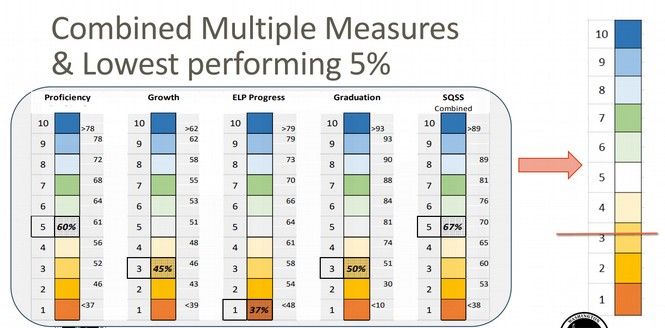
Put in plain English, decile ranking artificially puts all schools into 10 groups. And from there, it creates differences among the schools evenly distributed on a scale of 1-10 even when the schools might be nearly identical. In other words, the decile system exaggerates differences between schools. In the decile system, you cannot have a variable whereby schools are depicted as nearly identical. This new system may seem better in terms of telling schools apart. However, it hides the fact that in some areas, many school may be doing equally well such that a minor change in raw scores can result in a huge change in decile scores. This drawback of decile scoring is another reason why no other state in the nation is using this complex system. To make matters even more confusing for parents and tax payers, OSPI is combining five different variables, each ranked into 10 deciles to create the overall score for any given school. Below is an example of what the new school ranking or rating system will look like here in Washington state:

04

http://www.k12.wa.us/ESEA/ESSA/pubdocs/ESSAConsolidatedPlanWebinarPresentation.pdf

In the above example, a Proficiency score of 60% on the unreliable and invalid SBAC Math and English tests will give a school a Proficiency decile ranking of 5 - but an improvement of only 3% in the SBAC scores will result in a 10% increase in the Proficiency Decile ranking. The same is true of the Growth scale where a minor change in growth in the unreliable test scores results in a huge change in the Decile Growth score. In other words, decile scores are not reflective of real student performance. Decile scores are exaggerations.

ELP or English Language Progress means that English Language Learning students are making enough annual progress to transition out of the English Language Learner program in 6 years – regardless of their initial starting point. Thus, ELP progress is a very skewed distribution. Graduation Rate and SQSS (Attendance, Dual Credit, etc) are even more skewed. These five erratic scores are then combined together in a weighted fashion to produce a total school ranking – which in the case of the above school would be a 3 (out of 10). Science test scores (also unreliable and invalid) are not included in the current overall score but will be added beginning in 2021.

Naturally, OSPI claims that this new extremely complex and unreliable Decile school assessment system will magically help close the achievement gaps (while failing to do anything about the underlying childhood poverty problem). Here is a quote describing the new plan:

“In the WSIF, schools are measured along nine indicators. Six of the measures are academic, including graduation rates, growth and proficiency on state tests in math and English, and English learner progress. The other three indicators are new to school accountability. They are Attendance, 9th graders on track to graduation, and (College) Dual credit/advanced (AP) course-taking.”

The last three factors are all lumped together into a new variable called SQSS which is the School Quality Scale Score.

Now that we know what WSIF is claiming to measure, let’s look at how the school ranking of the top 216 schools was actually done. Download the Excel spreadsheet at this link to get the complete spreadsheet for the list of 216 schools. http://sbe.wa.gov/our-work/accountability/2017-2018-state-recognized-schools

The schools are listed alphabetically by school district (Column F). There are three Recognition Routes. These are growth, achievement and gap closing (Column B). Note that the first school listed is for Growth, the second school listed is for Achievement and the third school listed is for Gap Closing. Scroll to the right to see the section Eligibility Information.

05

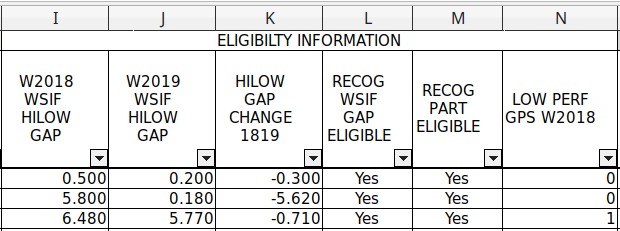
There are six variables listed in this section. At the bottom of the spreadsheet is a tab called Data Definitions. Click on this tab to see how these variables are defined.

Variable

Definition

W2018 WSIF HILOW GAP

Gap in decile points between the highest and lowest performing student groups on the winter 2018 WSIF

W2019 WSIF HILOW GAP

Gap in decile points between the highest and lowest performing student groups on the winter 2019 WSIF

HILOW GAP CHANGE 1819

Change 2019 minus 2018

RECOG WSIF GAP ELIGIBLE

Was the gap decreasing and the minimum WSIF value increasing

RECOG PART ELIGIBLE

Did school meet participation requirements on the spring 2018 testing

LOW PERF GPS W2018

Number of low performing groups from the winter 2018 WSIF


What does this mean? “Gap in decile points between the highest and lowest performing student groups” It means that there is some student group, such as those not eligible for free and reduced lunch, that did well on the SBAC test. There is another group, such as those eligible for free and reduced lunch that did not do well on the SBAC test. The difference in scores converted to decile ranking is the HILOW gap. Thus, for the third school in the table above, the gap in 2018 was 6.48 deciles and for 2019, the gap was 5.77 for a annual change of - 0.71 deciles. Elsewhere, it is noted that the Gap Improvement must be at least - 0.65 deciles.

Here is a link to a 23 page Washington State Board of Education 2018 document which attempts to explain these so-called variables. https://www.sbe.wa.gov/sites/default/files/public/meetings/Mar-2018/03%20Accountability%20Update.pdf

Here are some quotes:

“The new Index ratings appear to be more strongly correlated to socioeconomic status of the school, than the old Index.”

In plain English, schools with more low income students are punished under the new system even more than they were under the old system. This is because the new SBAC Math and English tests are extremely biased against low income students. The 103 highest ranking schools had only 16 percent free lunch kids while the 105 lowest ranking schools had 77 percent free lunch kids.

“Elementary schools represent 63 percent of all schools but 79 percent of highest performing schools. High schools are 18 percent of all schools but only 3 percent of highest performing schools.”

In plain English, if one looks at SBAC test results, the questions are much easier for grade school students to get a passing score than for high school students to get a passing score. Put another way, SBAC is biased against middle school and high school students. Adding attendance to the rankings also benefits elementary schools since students have higher attendance at elementary schools than at middle schools or high schools. Thus, only 20 high schools in the state got an award while more than 100 elementary schools got an award. The new system is also biased against 337 small schools who were not assigned an index rating because they did not have enough students. Here is the ESSA weighting of variables:

Elementary and Middle Schools: 50% growth in test scores, 40% Proficiency, 5% EL Progress, 5% SQSS.

High Schools: 50% graduation, 30% Proficiency, 15% SQSS, 5% EL Progress.

How to Sort the 216 Schools by Award Type
If you select the top cell in Column B, then click Data, Sort in the top menu, then in the Options tab, uncheck Include Formats, you will see all of the columns selected. Click OK. This will put all of the Achievement Awards together. There were 69 awards that went overwhelmingly to schools in the most affluent school districts in the state. Next there was about 100 Gap Closing Award schools and about 40 growth schools.


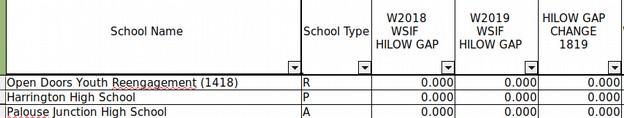
We are concerned primarily with the 100 Gap Closing Schools and columns I J and K which is the change in gap from 2018 to 2019. Here are the first 30 schools on the list of 100 Gap Closing Schools:

06

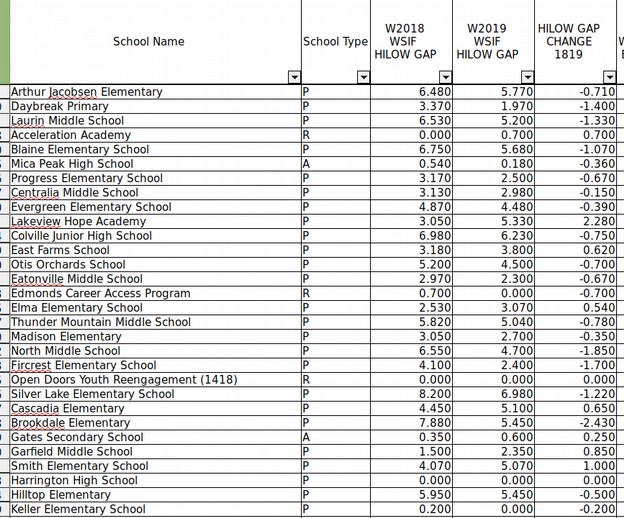
Note that in 2018 and in 2019, some of these schools had extremely high gaps – as high as 8.2 deciles (meaning that one group was in the top ten percent while the other group was in the very bottom). Meanwhile, other schools on this same list had a gap of ZERO (meaning that the high performing student group and the low performing student group were in the SAME DECILE! Put another way, there was no achievement gap at all. Even worse, about 40 of the 100 Achievement Gap Closing schools were rewarded for increasing the achievement gap from 2018 to 2019.

Below is a table of these schools ranked with those who increased the achievement gap the most at the top of the list:

07

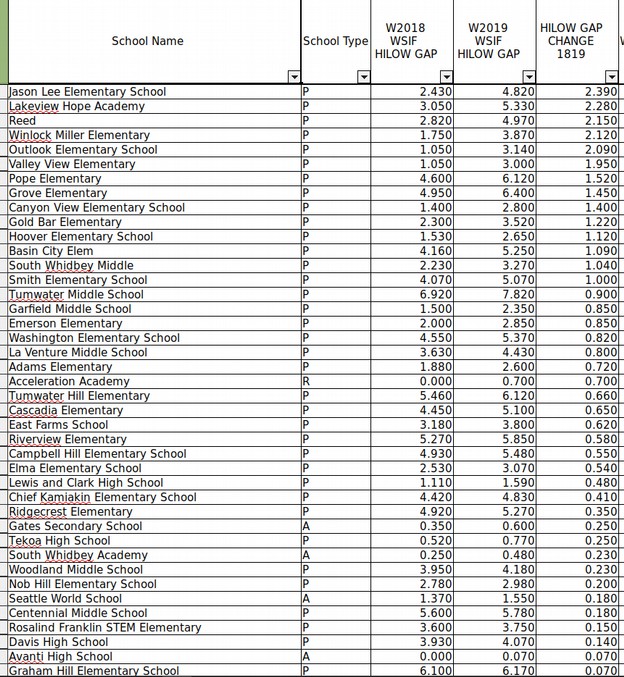
Many of these schools have extremely low academic records and instead of being given an award, they should probably be closed. For example, check out the Acceleration Academy in the Bethel School District.

How to View the New Ratings for an Individual School
To see the new Decile Report for an individual school, you first need to go to the OSPI Report Card Page. https://washingtonstatereportcard.ospi.k12.wa.us/


Then click Choose from a List. Then select the name of the school district. Then select the name of the school. Then click GO. Then scroll down the page and click WSIF in the lower left corner. Then click Details. Here is the new Assessment Table for the Acceleration Academy:

08

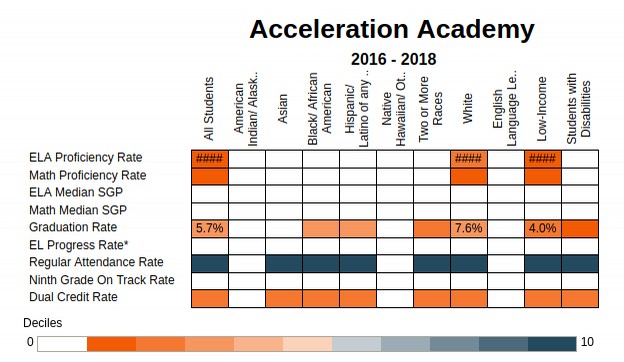
The Acceleration Academy has 193 students. Zero percent met math standards, zero percent met English Standards, only 6% graduated within 4 years. The drop out rate was 92%. And the Achievement Gap increased from 2018 to 2019. For these “accomplishments” Acceleration Academy was one of only 10% all Washington schools to get an award! This is beyond ridiculous. For this reason alone, the new Washington School Assessment System should be permanently shut down.

Gates Secondary School in Franklin Pierce has 135 students. 36 percent attend class on a regular basis. Only 20% met State math standards and only 35% met state English standards. Only 4% passed the State science test. The cost of this program is double the state average at nearly $25,000 per student. They have 16 teachers meaning that there is a very low 8 students per teacher ratio. Despite the low test scores and low attendance, the graduation rate is 71%. The Achievement Gap increased despite being less than one decile to begin with. So they got an award.

Here is the Gates School new Decile Assessment Table:

09

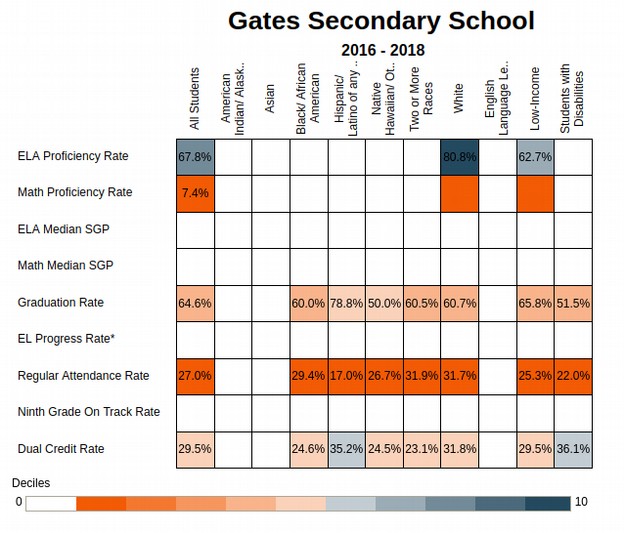
Because the low income students and the high income students did equally bad on the state math test and graduation rate, the Gates school got an award for closing the achievement gap. Never mind that only 30% of the students attended school on a regular basis.

Avanti High School in Olympia has 140 students with 63% or about 100 students attending school on a regular basis. 20% met the State Math standard and 85% met the English standard. 65% graduate within 4 years. The Achievement Gap increased from zero to 0.70 deciles – a minor change. Yet for this statistical blip, they got an award – for reducing the achievement gap.

Below is the Avanti High School Decile Assessment Table

10

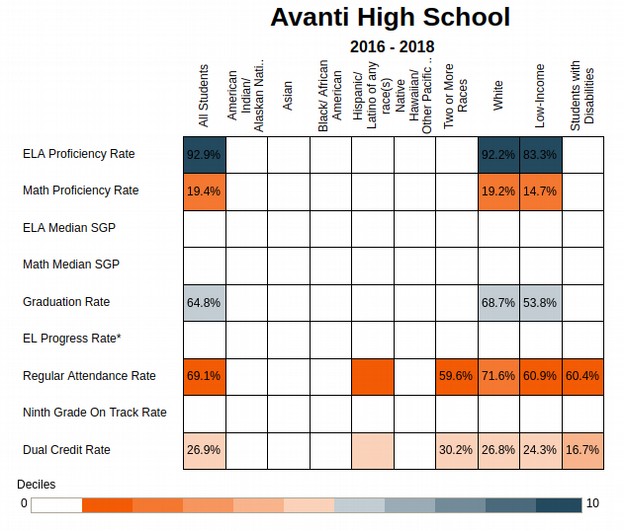
It is very difficult to explain why this school got an award. Perhaps it has something to do with a hidden weighting factor. There are also three schools on the Achievement Gap Closing award list that had no achievement gap in either 2018 or 2019:

11

Here is the track record for the Open Doors Youth Reengagement School in the Federal Way School District. There are 233 students in this program. Supposedly 100 percent of these students attend school regularly. In fact, Open Doors is a very bad computer login school in which NONE of the students attend regularly. None of the students met the state math standard and none met the state English standard and only 8% graduate in 4 years. Here is the colorful decile table for the Open Doors Program:

12

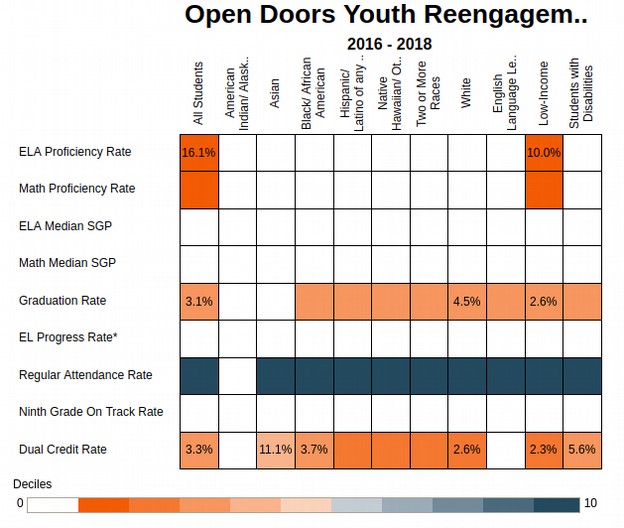
I have written about the complete failure of the Open Doors Program many times over the past several years. It is a computerized program that offers no real help to struggling students. In fact, because the students can simply log in, students are rarely there. None of these students can pass the state math standard and the graduation rate is almost non-existent (only 3%). Yet somehow the new state assessment system wound up giving this terrible program an award. This is truly insane.


Conclusion
The students and teachers in Washington state deserve better than an school assessment system that randomly passes out awards based either on the wealth of the parents or statistical aberrations in a complex decile system not used anywhere else in the nation.


13

Two years ago, I wrote an article describing an holistic and authentic Assessment System which was not based on unreliable SBAC test scores but rather was based on the assessment system used in Finland. https://coalitiontoprotectourpublicschools.org/trust-teachers/authentic-assessment-of-students-teachers-and-schools

Here is a quote from this article: “Finland does not use mandatory high stakes tests as we do in the United States. This has led some people to claim that Finland does not do anything to assess their students. This is not correct. Finland assesses all students on an annual basis. It is just that Finland uses holistic and authentic formative and summative assessment methods rather than a single test score from a bubble test. These “real” assessments are more useful for students, teachers and parents. While Washington state spends hundreds of millions of dollars on worthless high stress high stakes tests that have no academic value for students, Finland spends money hiring more teachers to lower class sizes and then trusts the teachers to provide students with diagnostic assessments to identify academic areas where a student needs improvement. There is also a “summative” assessment at the end of the school year. But even these summative assessments rely on student performance with assignments and projects rather than scores on tests. The goal is to aid student learning rather than to rank, label and punish students.”

Here is a graph of what an authentic assessment system would look like:

14

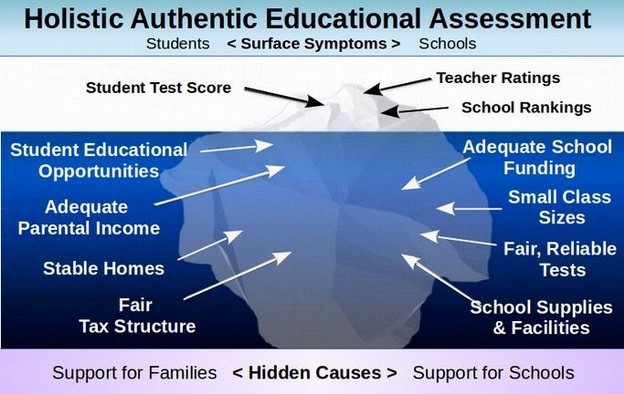
If we truly want to help struggling students, instead of a toxic testing system based on ranking, punishing and controlling teachers and students, we should use a diagnostic assessment system that identifies areas where students need improvement and provides teachers with the resources they need to assist struggling students in a timely manner. Instead of an expensive and time consuming testing system, we need a holistic and authentic assessment system that is aligned with Child Development research. Instead of a high failure rate SBAC testing system developed in secret by Wall Street consultants, we need a high success rate assessment system developed in the open by teachers and child development specialists.

Most of all, instead of trusting for profit corporations to run our schools, we need to return to trusting and respecting teachers as the real experts in the design and implementation of a program of educational excellence for all students. As always, I look forward to your questions and comments.

Regards,

David Spring M. Ed. Coalition to Protect our Public Schools

This email address is being protected from spambots. You need JavaScript enabled to view it.

What is a Constitutional Level of School Funding in Washington State?

On February 1, 2017, Senate Republicans passed Senate Bill 5607, also known as the Republican School Plan. This plan has a $1.4 billion dollar shortfall in school funding in addition to robbing King County Schools of about $1 billion per year. On Monday, February 6, 2017, at 3:30 pm in Olympia, the House Appropriations Committee will hold a public hearing on Senate Bill 5607 and House Bill 1843 , also known as the Democrats School Plan. Unfortunately, the Democrats School Plan also includes no additional funding for schools and in fact is a shortfall of billions of dollars in school funding. In this article, we will therefore look at why both the House and Senate bills fail to provide ample school funding and what level of school funding is required by the Washington State Constitution and the McCleary School Funding Decision. Please share this article with other parents and teachers. Then come to the public hearing on February 6, 2017, oppose both bills and demand that our legislature provide ample school funding as required by our State Constitution by focusing on the real school funding problem and repealing billions of dollars in corporate tax breaks.

01

Why the Washington State Constitution Matters
Republicans and Democrats use our current unconstitutionally low level of funding as the baseline to conclude that they are “increasing funding” for our schools. Current inadequate funding is NOT the correct baseline. The correct baseline is what our Constitution demands, what our Supreme Court demands and what the legislature has promised parents and the Supreme Court for the past 8 years. Current law is not the current level of funding. Current law is the prototypical school model – a model that pinky promises an increase in state funding of more than $6 billion per year beginning in the 2018 school year. Current State law also includes the Class Size Initiative 1351 which adds another $1.4 billion per year in addition to the $6 billion in the Prototypical school promise. Thus, the correct baseline with which to compare the Republican and Democrat plans is current funding PLUS $7.4 billion more per year.

Since both the Republican and Democrat plans provide no real funding source, both plans are a cut in school funding of at least six billion dollars per year. Our Supreme Court ruled that the Prototypical School model would meet our State Constitutional Paramount Duty to amply fund our public schools. The legislature repeatedly promised our Supreme Court they would come up with this money by the 2018 school year. What we are now seeing from both political parties are “Bait and Switch” tactics reneging on year after year of empty promises by now presenting hollow proposals which utterly fail our kids and ignore our State Constitution.

Here is a link to the Republican Plan, Senate Bill 5607 in case you would like to read it:
http://lawfilesext.leg.wa.gov/biennium/2017-18/Pdf/Bills/Senate%20Bills/5607-S.pdf

We have previously provided a detailed analysis of the drawbacks of the Republican Plan which you can read at the following link:
https://coalitiontoprotectourpublicschools.org/latest-news/forty-reasons-parents-teachers-should-oppose-the-republican-education-plan


In this article, we will briefly review the drawbacks of the Democrats plan and then compare both plans to what is required by our State Constitution. We will then conclude with a simple solution that would comply with our State Constitution without any major changes to existing state law – simply by repealing a $5 billon per year tax break for the super rich.

02


Drawbacks of the Democrats Plan
You can read the Democrats plan at the following link:
http://lawfilesext.leg.wa.gov/biennium/2017-18/Pdf/Bills/House%20Bills/1843.pdf

Here is a link where you can submit written comments about this bill:
https://app.leg.wa.gov/pbc/bill//1843

Page 1, Line 19 says that state funding must correspond to the cost of providing students… In fact, what our Supreme Court has said repeatedly is that state funding must correspond to the ACTUAL COST of providing students with an education. What the McCleary lawsuit is all about is that there is a huge difference between what the legislature currently provides for school funding and what we all know the actual cost of school funding is. Our State Constitution and our Supreme Court require the legislature to provide for the full, actual cost of funding our schools.

How to Get Your State Party to Oppose Common Core

01
On January 24, 2015, a miracle happened in Washington State. The Washington State Democratic Party became the first Democratic State Party in the nation to pass a resolution opposing Common Core! This is huge because Washington State is not only the home state of Bill Gates, it is also the home state for the SBAC Common Core test. If Washington state pulls out of Common Core, it could bring the entire project crashing to the ground.

We realize that several Republican controlled states have already rejected Common Core. But it is much easier for a Republican controlled state to reject Common Core than it is for a Democratic controlled State to reject Common Core. All Republicans have to do is call it “ObamaCore” and blame the entire thing on those “Damn Democrats” and Republicans will jump at the chance to get rid of Common Core. For example, the Washington State Republican Party passed a resolution opposing Common Core over a year ago. But not all states are Republican states. Nor do children come with D's or R's stamped on their foreheads. For a Democratic state to pass a Resolution opposing Common Core requires going against a sitting Democratic President and also going against nearly the entire Democratic Party political leadership – who are all aligned with Obama and Arne Duncan just as Common Core tests and Common Core books are (supposed to be) aligned with Common Core standards.

A Brief Lesson in Political Organizing
For parents and teachers living in Democratic controlled states and wanting to escape from the death grip of Common Core, we would like to explain how this miracle happened – so that you can use this process to pass a similar resolution in your state. First, we have been working on this issue for nearly a year. So it will take a lot of patience and determination to overcome the wealthy billionaire controlled wing of the Democratic (or Republican) Party. Do not expect overnight success. You should write a well organized resolution that takes no more than one page. Our successful resolution is at the end of this article if you would like to read it. Feel free to copy it. Unlike Common Core, it is not Copyrighted!

Second, it is helpful if at least some members of your group are already members of your state's Democratic Party. One of us, David, has been a Precinct Committee Officer (PCO) in the Democratic Party for more than 14 years in East King County, near Seattle Washington.

The other of us, Elizabeth, is a new PCO for a different legislative district in North Seattle, Washington. Even if you do not like politics, you should join your local Democratic or Republican party and start attending monthly party meetings in your legislative district. You will find that most people in grass roots politics care about our kids and about the future of our country just like you.

Third, it is helpful if you have passed other resolutions at various levels of the Democratic or Republican Party in the past and have at least some idea of how the process works. We have previously passed SIX resolutions in the State Democratic Party before the Common Core Resolution. These include resolutions in favor of a State Public Bank, restoration of Glass Steagall Banking Regulations, Getting the Money out of Politics, and Restoring a Fairer GED test. So this was our seventh successful resolution. But it was also by far the hardest to pass. So try to connect with people who know how the resolution process works. It is essential to start at the legislative district level. Start with your own legislative district. Attend several monthly meetings. Get to know the other folks attending the monthly meetings.

Fourth, find parents and teachers whose kids are struggling with Common Core. Most kids are having a terrible time. Ask these parents and teachers to help you pass a resolution in your legislative district. After you pass a resolution in your legislative district, work on passing the resolution in neighboring legislative districts. Eventually, we were able to get the Resolution Opposing Common Core passed in four legislative districts in Washington state.

02
Fifth, also join your State Party Progressive Caucus or some other statewide caucus in your political party. Look for folks who really support public schools and are opposed to the billionaires privatizing and taking over public schools. The more wealthy democrats are called “New Democrats.” These are the folks who are in it for the money and are paid off by the billionaires. The benefit of having the resolution passed by the Progressive Wing of the Democratic Party is that these folks are often extremely long time Democrats and they really know the ropes and how to get things done – despite the opposition of the corporate or “New Dems” wing of the Democratic Party. Many are also on the County and /or State Resolutions Committees.

Sixth, the next task is to get the resolution considered by the County Resolutions Committee. It is helpful if you have friends on this committee and/or can get to know the members of this committee.

Seventh, the next task is to get the resolution considered by the State Resolutions Committee. This group only meets three or four times per year. There are lots of rules that have to be met to get a resolution considered by the county committee or the state committee. These rules are usually posted on the County Democratic Party website and/or the State Democratic Party website.

Eighth, get to know your progressive State Party leaders. These are elected representatives who care more about kids and parents and teachers than about keeping billionaires happy. We are lucky in our State to have State Senator Maralyn Chase in our corner. Having a well respected leader of the State Party on your side will help because the billionaires will certainly have some state party leaders on their side.

03

Ninth, get some upset parents and upset teachers on your side. We were very lucky to meet a group of upset teachers called Washington Bad Ass Teachers, who understood that Common Core is very bad for kids. These parents and teachers played a crucial role in helping us get the last few votes we needed to get the resolution passed because thankfully teachers are still highly respected in our state and state delegates were willing to listen to these teachers talk about how Common Core harms kids.

Tenth, build a website where parents, teachers and State Party delegates can go to learn more about why they should support your resolution. We built a website called “Weapons of Mass Deception (dot) org. To learn more about how to build your own website using a free platform called Joomla, visit one of our other websites: http://buildyourownbusinesswebsite.org/


Strategy At the State Party Meeting
After getting the resolution passed at a legislative district meeting and or a county meeting, it is forwarded to the state party for consideration at the next state party meeting.

You need to go to this meeting a day in advance – because the State Resolutions Committee usually considers resolutions the evening before the main state party meeting. Bring a one page flier of no more than ten reasons why those on the resolutions committee should vote for your resolution. Arrive to the committee meeting early and make sure that everyone on the committee gets a copy of your handout. In Washington State, there is usually about 30 people on the resolutions committee. Your state may be bigger or smaller than our state.

The first task of the resolutions committee is to “clean up” your “poorly written” resolution. Do not argue with them. They have been writing resolutions and cleaning up resolutions for years. Let them fix your resolution. They know what they are doing. The second task of the resolutions committee is to decide whether to recommend that the main group “pass” or “not pass” or “table” the resolution or send it to the main body “without recommendation” so it can be debated by the main body.

Because Common Core is very controversial in Democratic states, do not be surprised if it is passed to the main body without recommendation. That was what happened to us. The state resolutions committee usually meets on a Friday night and the main State Party meeting is the following afternoon from 1 to 4 pm. We prepared about 300 handouts to pass out. These were 40 for the Resolutions Committee plus 60 for the Progressive caucus meeting on Saturday morning plus 200 to place on chairs at the main state party meeting 30 minutes before the meeting is scheduled to start. After attending the progressive caucus meeting on Saturday morning, meet with your group of parents and teachers. Hopefully, they will have signs and their own handouts to pass out at the main meeting. Hopefully someone experienced with the process should explain what will happen at the state party meeting.

04

The goal is to get your team to the meeting before it begins and pass out the fliers with one on every chair. Then have parents and teachers on your team circulate around the big room as the state delegates begin to arrive.

The goal of each parent and teacher is to talk with just a few delegates before the main meeting is called to order. You will have about 20 minutes after the delegates arrive. There were 8 of us and with each talking to about five delegates for about 4 minutes each. Together, we were able to share our stories with about 40 out of the 200 delegates. Our goal was simply to “tip” a close vote in our favor. As you approach a delegate, ask them if they have heard of Common Core and if they have decided how they will vote on the resolution.

Most delegates will be undecided and will usually give you a couple of minutes to explain to them why they should vote for the resolution. If a delegate has already decided, then move out to someone who is undecided. Do not waste these precious minutes trying to convert someone whose mind is already made up. If a delegate does not support the resolution, then just chalk it up to “Bill Gates and his billions in corporate propaganda.”

You also need to meet with the State party delegates who will each give a two minute speech in favor of the resolution. You need at least two and hopefully three speakers qualified to speak. These folks will likely be state committee delegates from the legislative districts that passed your resolution earlier in the year. They need to not only know about the drawbacks of Common Core, they also need to be able to speak clearly. It is also helpful if they are well known and well respected by other members of the Democratic Party. So choose wisely. We were lucky to get Sarajane Siegfriedt, the chair of the King County Legislative Action Committee and member of the State Resolutions Committee to speak in favor of the motion. We were also lucky to get Brian Gunn, the chair of the State Progressive Caucus to speak in favor of the motion. Brian said, “Corporations are looking at our children as commodities. We’re allowing corporations that produce these materials and sponsor these tests to treat our children as sources of income...a source of profit. And that source of profit is our own children.”

05

Our final speaker was Richard May, a leader of the Whatcom County Democrats who is also a parent. Richard spoke of the negative impact Common Core had on his two daughters.

Richard said that “Common Core sucks... All of the parents and teachers in Bellingham hate it.”

08

Do not be surprised if the wealthy wing of the party tries to sabotage the issue. In our case, the leaders of the party read a letter from a well known state senator urging the group to vote against the resolution. She warned the group that should this resolution pass, it would make passing a state budget and getting school funding much more difficult. This of course was a lie. Common Core costs our state more than 300 million extra dollars for the tests and books. But the goal of the billionaires is not to tell the truth. It is simply to deceive the public.

Next was the big vote. We thought it would be very close – especially after the letter from one of the leaders of the democratic party was read. As it turned out, we won the vote by a two to one margin – with more than 120 state party delegates voting to ignore their own state party leaders and ignore their own President and support our resolution.

The other good news is now that Common Core is officially opposed by both the Republican and Democratic Party in Washington State (perhaps the first time we have ever agreed on anything), there will be a bill introduced in the state legislature halt Common Core in Washington State. In our opinion, the most crucial element of our success was the presence of real parents and real teachers speaking from their hearts about how Common Core harms their kids.

The other important factor was the year we spent building our team and building support one person at a time and one legislative district at a time within the Democratic Party. Common Core is an extremely complex issue that has billions in marketing used to fool parents. It takes one on one talks to overcome this marketing blitz. But we proved it can be done. We hope you have as much success in your state as we had in ours. Below is a copy of our successful Common Core resolution. Be sure to visit our website to learn more about the drawbacks of Common Core. Here is the link.
http://weaponsofmassdeception.org/

Resolution Opposing Common Core State Standards

WHEREAS the copyrighted (and therefore unchangeable) Common Core State Standards are a set of controversial top-down K-12 academic standards that were promulgated by wealthy private interests without research-based evidence of validity and are developmentally inappropriate in the lowest grades; and

WHEREAS, as a means of avoiding the U.S. Constitution’s 10th Amendment prohibition against federal meddling in state education policy, two unaccountable private trade associations--the National Governors Association (NGA) and the Council of Chief State School Officers (CCSSO)--have received millions of dollars in funding from the Gates Foundation and others to create the CCSS; and

WHEREAS the U.S. Department of Education improperly pressured state legislatures into adopting the Common Core State Standards and high-stakes standardized testing based on them as a condition of competing for federal Race to the Top (RTTT) stimulus funds that should have been based on need; and

WHEREAS as a result of Washington State Senate Bill 6669, which passed the State legislature on March 11, 2010, the Office of the Superintendent of Instruction (OSPI) adopted Common Core State Standards on July 20, 2011; and

WHEREAS this adoption effectively transfers control over public school standardized testing from locally elected school boards to unaccountable corporate interests who stand to profit substantially from CCSS; and

WHEREAS the Washington State Constitution also calls for public education to be controlled by the State of Washington through our elected State legislature, our elected State Superintendent of Public Instruction and our elected local school boards; and

WHEREAS implementation of CCSS will cost local school districts hundreds of millions of dollars to pay for standardized computer-based tests, new technology, new curricula and teacher training at a time when Washington is already insufficiently funding K-12 Basic Education without proven benefit to students; and WHEREAS some states have already withdrawn from CCSS;

THEREFORE BE IT RESOLVED that we call upon the Washington State legislature and the Superintendent of Public Instruction to withdraw from the CCSS and keep K-12 education student-centered and accountable to the people of Washington State.


What is Next?
Once you have managed to change the official position of your state party, the next step is to write and pass a law in your state legislature to match the intent of the resolution. That is the subject of our next section.

The Ugly Truth about AVID

In this report, we will examine the objective scientific research on a billionaire promoted, quick fix, miracle cure, Ed Reform program called AVID - which claims to help low income struggling students simply by teaching them better study habits. No need for lower class sizes and more teachers. No need to make sure parents have a good paying job so kids have a stable home environment and food to eat. In the interest of full disclosure, as a person who grew up in a poverty and knows what is it like to be hungry, I find it deeply offensive for billionaires to be promoting such programs at a time when the child poverty rate in Washington state is 50% and 35,000 students are homeless and living on the street or in the back of a car. Poor struggling students need much more than just better study habits. It is grossly insulting to blame poor students for the fact that they are struggling in our grossly overcrowded schools - schools that are over-crowded because billionaires refuse to pay their fair share of state and federal taxes.

If you do not have time to read the whole report, our conclusion is that there have been only four scientific studies done on the AVID program. All four found that there was no significant difference between students who went through the AVID program versus similar students who did not go through the AVID program. This is shocking since the AVID program, unlike our real public schools, gets to cherry pick which teachers and students get to participate in the program. This is fairly typical of Ed Reform programs. None of them have shown any evidence of working. But they are spread around the US like wildfire by the marketing slogans of greedy billionaires interested in making a buck off off of our public schools.

There are two reasons for taking a close look at the AVID program. The first is that 15 school districts in Washington state have already adopted this program. Below is a chart showing the rapid rise in the number of students involved in the AVID program.
http://www.avid.org/dl/wd/wd_dc_washington.pdf

01
According to AVID, the graduation rate from their program is nearly 100%:

02

A recent OSPI study came up with a different result. They claimed that AVID schools have a graduation rate of 80%, which is near the state average, but better than some undefined "comparison schools" that are only at 75%.

03

http://www.k12.wa.us/advancedplacement/pubdocs/2-2014CRIAVIDNav1012014DataCollection.pdf


The other reason Washington parents and teachers should take time to examine the AVID program more closely is that Erin Jones, the AVID program director for the Tacoma School District is running for Washington State Superintendent of Public Instruction. At a recent candidate forum, Erin claimed that the AVID program was a huge success in Tacoma and that she wanted to implement something like it statewide if she is elected Superintendent of Public Instruction.

Erin claimed that the AVID program was responsible for the dramatic increase in the graduation rate of the Tacoma School District. She seemed to be completely unaware that there has been no increase in the actual graduation rate in the Tacoma School District. Instead, the Tacoma School District artificially inflated their graduation rate by hiding over 800 struggling low income students in an extremely bad online program that only graduates 30% of their students. While 7 other large school districts were found to be misreporting the number of students in their 9th grade cohort, the Tacoma School District was by far the worst offender in the entire state of Washington.

04

For more on this shocking scandal, see the following link:
https://coalitiontoprotectourpublicschools.org/latest-news/end-the-struggling-student-shell-game

Setting aside the dishonest tricks used by the Tacoma School District, the question is whether there is any scientific evidence that the AVID program really works to help students. Answering this question is difficult because Bill Gates funded the AVID program and also paid millions of dollars to fake research groups to produce fake studies claiming that AVID works. One needs to wade through a pile of fake studies to find any real research. In this report, we will first describe the AVID program and then describe the research that has done about it.


What is AVID?
AVID (also called Advancement Via Individual Determination) is a program started in San Diego in 1980. It targets "middle achieving students" who are getting Cs and Bs in their courses and tries to "accelerate" their academic development to make it more likely that they will be "career and college ready" by teaching them better study habits like taking notes when they read and then keeping all of their notes for every class in a giant three inch binder.

The AVID website claims that they were the precursor of Common Core "career and college ready" slogans and they may be right. Here is a quote from the AVID website: "The Common Core State Standards reflect the path that AVID students and educators have been following for more than three decades."

The AVID program subjects a select group of middle achieving kids to a "rigorous" program that includes instruction in taking notes while reading and organizing notes from all of their courses into a huge three inch thick three ring binder that students carry from class to class. Every Friday, there is a "binder check."

Note that the AVID program fails to deal with the real at risk students which are students getting Ds and Fs in their school. Even C and B students have to be invited to the program and go through an interview process in which they agree to make a "commitment" to try harder. Thus, it blames the student for their struggles instead of blaming the billionaires who fail to pay their fair share of taxes - thus forcing students to attend schools where the class sizes are too large.

So in some ways, the AVID program is like the charter school program called KIPP (Kids In Prison Program). It is a program where every kid is put on an identical path to success as if they were a robot. This makes it very similar to Common Core. Poor struggling kids are expected to pull themselves up by their boot straps. Kids who fail in this boot camp style drill and kill system are simply discarded as not having enough "personal drive."

Teachers are taught the AVID system by special counselors during a couple week session in the summer - similar to how Teach for America runs a 5 week teacher boot camp program. So you can think of AVID as a dream come true for Ed Reformers as it is Common Core, Charter Schools and TFA all rolled into one big happy package. Instead of spending billions of dollars to build more schools and provide struggling students with more teachers and lower class sizes, stuggling students are expected to "take responsibility for their own learning." It is interesting how the billionaires want us to focus on all kinds of "magic bullet" schemes like AVID rather than requiring billionaires to pay taxes so we can afford to build schools and hire teachers.

These school intervention schemes are so profitable that there are now more than 242 programs like AVID (but with different names) operating in 42 states! Nearly all of these programs divert both federal and state tax dollars away from schools and into the pockets of the promoters of these snake oil magic potions.

Speaking of cost, the federal government estimated the cost of AVID at about $10,000 per classroom of 30 students per year.
http://www2.ed.gov/pubs/ToolsforSchools/avid.html

$10,000 per class of 30 kids may not seem like very much. But if comes to $333 per student per year. If the program were expanded to all one million students in Washington state, the cost would be $333 million per year. At 10 experienced teachers per million, this is 3,330 teachers who would have to be fired in the state of Washington in order to pay for this program. So instead of having lower class sizes, struggling students would be forced to deal with higher class sizes.


Research on AVID
There has been little objective research on the effects of the AVID program on student achievement as measured by students’ performance on standardized achievement tests. Rorie (2007) found that there was no significant difference between AVID students and Non-AVID students in a Colorado study.
http://ies.ed.gov/ncee/wwc/pdf/intervention_reports/wwc_avid_app_091410.pdf

Lake (2009) also found no significant improvement on assessment scores in the areas of mathematics, reading, and writing in a Kansas study.
https://www.bakeru.edu/images/pdf/SOE/EdD_Theses/Lake_Tony.pdf

The Lake study was interesting as it was not a classic random assignment experiment. Instead, a school district that had been convinced to try the AVID program identified 209 C and B entering 9th grade students who were invited to participant in the AVID program. About 100 students chose to participate (Group 1) and 100 chose not to participate (Group 2). Even though Group 1 consisted of the more highly motivated students who were then subjected to one full year of AVID training, when one compared the mean test scores of the two groups at the end of the year, there was virtually no difference. Here is a chart of their Reading Results:

05

There was also almost no difference in the math scores between the two groups. In fact, the non-avid kids did slightly better than the AVID kids:

06

Most shocking was the results of the writing test. Even though the AVID kids had a full year of AVID coaching teaching them how to "write more clearly" they actually performed worse on the state writing test than they had the previous year!

07

In the most recent study, researchers analyzed 14,000 students who had been subjected to the AVID Ed Reform system in the Chicago School District. They were unable to find any significant benefits to the program.
http://www.edweek.org/media/cognitivescience-30avid.pdf

Here is a quote describing this study: "As part of a larger initiative to improve student preparation for and access to postsecondary education, researchers working with Chicago Public Schools evaluated the impact of AVID on over 14,000 ninth-grade students' learning and study skills. Researchers drew upon data from the school district; surveys of principals, teachers, and students done by the Consortium on Chicago School Research; and Consortium surveys of students in AVID classes. Survey data was used to evaluate whether AVID students reported more positive learning and study behaviors, greater support from teachers, and increased involvement in college planning. Findings indicated a lack of strong effects, leading researchers to conclude that instruction in supportive skills may not translate to large urban districts, and to question whether a program can improve student skills without changing what is happening in the classroom."

What Works Clearinghouse, under the Institute of Educational Sciences, reviewed 66 peer-reviewed studies and found that AVID shows no evidence of impact on student reading comprehension.
http://ies.ed.gov/ncee/wwc/pdf/intervention_reports/wwc_avid_091410.pdf

But wait! If you go to the AVID website, you will find all kinds of research showing that AVID works very well. For example, the National Student Clearinghouse found that high school graduates from 2010 and 2011 who participated in AVID persisted through their freshman and sophomore years of college at a higher rate than their counterparts who were not in the program. The research found that 87 percent of AVID graduates enrolled in a second year of college, compared to 77 percent of students overall.

Sadly, the study was not done by an independent group of researchers. Instead, the National Student Clearinghouse received $7 million from Bill Gates to promote the Gates Junk Science reports on AVID and other Bill Gates Ed Reform scams.

08

This is the problem with allowing a billionaire to fund fake research with his fake non-profit instead of requiring him to pay his fair share of federal taxes so we can have real schools for our kids. The Bill Gates fake research is everywhere and people do not even realize they are being misled by it. But our kids are the ones who pay the real price. Because instead of getting the real teachers and smaller class sizes they need, they get some marketing program and a huge three ring binder.


What Students Say About AVID
Here is what one student posted on social media asking other students about the AVID program: "OK, so I'm wondering what fellow teens think of the decision my school has made. I am fourteen and just started the eighth grade. At my school, we have a program called AVID. It is supposed to help with 'organization' and uses a three inch giant binder. Now, I'm ADD and have a hard time organizing things, so my mom found AVID and made me take it last year. She wouldn't listen to me that it wasn't for a straight A honors student. It was the worst class ever (for me). The huge binder that held everything for all of our classes didn't work for me- it was horrible."

09

Here was the reply of another student who had been in the AVID program: "I got out of the program for this year (thank goodness) and decided over the summer to try and have three separate binders- each would have the stuff for three classes.  However, this year my school is having a mandatory 'Academic Notebook', which is an AVID three inch binder with all of the classes in it. Our school has been selected as an 'AVID Showcase' school- or something like that- and the administration is trying to make it look like AVID is the reason why. The only reason our school does so well is because we are in a very wealthy area. Many kids in my state are children of migrant workers and many schools have 80%+ on free lunch. Meanwhile, the schools in my area have the resources to earn the grades. It has nothing to do with AVID."

Here is another student: "Every kid in our school MUST have a three inch binder. It's insane. Several parents are complaining, but the school won't give in. Yes, the AVID binder works for many kids. But not all. Kids and teens who are taking high school credit courses and get A's use different systems for organization- and they do fine. Is it stupid for my school to force all students to use a specific organization technique?"

And another student: "It is very, very, VERY stupid of your school to be doing it... I mean seriously, what are they gonna do if you use a different form of organization? Just bring the binder, keep it in your locker, bring it to class just to play their game (that's what school is, a game) and then after a month or so, you can slowly stop bringing the binder and keep all your stuff filed and organized in your own way. That's how I did it, that's how I'll do it this year and I'm getting ready to graduate this year as a junior. So they can shove it!"

The kids appear to know more about the program and how to game the system than the adults who are paying for the program.

10

How is it that a program that does this poorly continues to exist and even expand?
Well, that is where a good marketing department comes in handy. Here is an explanation from the AVID website of how they keep getting more and more funding:

11

The real secret is to have a few billionaires and their wealthy corporations in your corner:

12

Thanks to these generous billionaires, AVID lift-yourself-up-by-your-bootstraps snake oil Is now being promoted in 5,000 schools in 44 states!


Conclusion
AVID is yet another in a long line of "magic bullet" quick fix solutions that cherry pick students and ignore the impact of poverty on children and families. AVID is another kids in prison, drill and kill, military boot camp pull yourself up by your boot straps program that blames struggling kids for their problems instead of blaming billionaires. While some students may benefit from the rigid AVID program, most if not all students would be better served by using the money now spent on AVID outside consultants to hire more teachers and offer students smaller class sizes to serve ALL students in the community and build a united program rather than splintering students into AVID versus Non-AVID kids. But what is really needed is much lower class sizes so struggling students can get the help they need to succeed in school and succeed in life. Lower class sizes require hiring many more teachers and building many more schools. The only way to do this is by requiring billionaires to start paying their fair share of taxes in Washington state. If we really care about helping struggling low income students, we should end tax breaks for billionaires and wealthy corporations!

As always, we look forward to your questions and comments.


Regards,
David Spring M. Ed.
Coalition to Protect our Public Schools
This email address is being protected from spambots. You need JavaScript enabled to view it.

How the Highline School District Uses the Struggling Student Shell Game to Artificially Inflate their Graduation Rate

This report is a follow up to an article I published in January 2016 called "End the Struggling Student Shell Game." In that article, I explained how some school districts in Washington state, including the Tacoma and Highline School Districts, werefailing to count hundreds of struggling high school students in order to artificially increase their graduation rates. See the following link to read this report: https://coalitiontoprotectourpublicschools.org/latest-news/end-the-struggling-student-shell-game

The clue that your school district is mis-reporting the graduation rate is if they only report the graduation rate and fail to also state the actual number of students who graduate. Here is an example of how the struggling student shell game is used to artificially increase the graduation rate.

Let's say there are 1,000 students in the 9th grade cohort in your school district for each of the past several years. Each year may be slightly different. But the total number has remained about the same for most school districts in Washington state for the past several years. Let's further say that only 600 of these 9th graders graduate four years later. This makes the graduation rate 600 graduates/1000 original 9th graders = 60%.

Now, let's say you want to lie to the voters about the graduation rate and use a skyrocketing graduation rate as evidence that your Ed Reform Miracle Cure Scams are working. A simply way to artificially increase the graduation rate is to "hide" 200 struggling students. Suddenly, the graduation rate goes up to 600 graduates/800 remaining students = 75%.

Note that the actual number of students graduating did not increase at all even though the graduation rate shot up from 60% to 75%. It remained at 600 students. This is why the only number reported to the press is the graduation rate - not the number of students who graduated or the number of students in the 9th grade cohort.

Where did the 200 struggling students go who are suddenly no longer part of the 9th grade cohort? They went into a place I call the ALE Loophole. ALE stands for Alternative Learning Experience, a corrupt program now made famous as the place where all of the 1000 charter school kids were illegally put by Randy Dorn in December 2015 after the Washington Supreme Court ruled that charter schools were unconstitutional. A common ALE scam is to put the struggling students into an Online program in a different school district. The problem with these Online Programs is that they offer no help to struggling students and have a graduation rate of less than 30%. Even though the struggling students all still live in their home school district, they no longer count as part of their home school district - and they also do not count as part of the cohort of their new school district. They simply become invisible. And sadly, instead of getting the help they need, most of these now invisible students never graduate.

Now that you understand how the struggling student shell game works, let's see how it is used by the Highline School District to artificially inflate their graduation rate.

States Leave Common Core SBAC and PARCC Tests like Rats Deserting a Sinking Ship

There are two Common Core high stakes high failure rate tests, called SBAC and PARCC. Both are paid for with more than one hundred million of dollars in tax payer “development funds” but also cost states hundreds of millions of additional dollars every year to administer. Originally, there were 45 states signed up for these Common Core tests. In the past couple of years, State after State has dropped out of the Common Core test nightmare like rats deserting a sinking ship. In just the past couple of weeks, Maine abandoned the SBAC ship and Ohio abandoned the PARCC ship. Of the original 45 states, 23 have now dropped out leaving only 22 states left – 15 SBAC states and 7 PARCC states.

How the Common Core Test Nightmare Started
In September 2010, Arne Duncan awarded $330 million to PARCC ($170 million) and SBAC ($160 million). According to a USDOE press release, 46 States signed up for either or both of the two Common Core testing scams. But given Minnesota's resistance to the assessments, we will list it as one of the five non-adopter States:

2010 PARCC ONLY – 14 States: Arizona, Arkansas, California, Florida, Illinois, Indiana, Louisiana, Maryland, Massachusetts, Mississippi, New Mexico, New York, Rhode Island, and Tennessee.

2010 SBAC ONLY – 19 States: Connecticut, Hawaii, Idaho, Iowa, Kansas, Maine, Michigan, Missouri, Montana, Nevada, North Carolina, Oregon, South Dakota, Utah, Vermont, Washington, West Virginia, Wisconsin, and Wyoming.

2010 BOTH PARCC and SBAC (observers only) – 12 States: Alabama, Colorado, Delaware, Georgia, Kentucky, North Dakota, New Hampshire, New Jersey, Ohio, Oklahoma, Pennsylvania, and South Carolina. This meant that PARCC originally had a total of 26 States and SBAC had a total of 31 States.

2010 Never Adopted – 5 States: Alaska, Minnesota, Nebraska, Texas, and Virginia. Only 5 States resisted the propaganda and bribery of the two Common Core tests.

Here is a map of the various States Common Core Tests in 2010.

01

Both Common Core Testing Scams Have Fallen Apart
The biggest loser has been PARCC – which is a test made by a terrible corporation called Pearson. As of January 2015, of the original 25 States in the PARCC camp, with 31 million students, there are only 10 States that have not yet abandoned the PARCC ship. These remaining states have only 5 million students. So PARCC total test takers have fallen by more than 80%:

PARCC Test down from 26 States to just 7 States
A minimum of 15 States is required to get $186 million in federal funding. However, PARCC is now now down to 7 States. In December 2014, Congress killed the remaining Race to the Top funding – which was funding both the PARCC and SBAC Common Core tests. It is therefore uncertain what Arne Duncan will do or how PARCC will be funded in the future. The first to leave PARCC was California which switched to SBAC on June 9 2011. This was followed by South Carolina in August 2012. In 2013, Alabama left in February, Pennsylvania left in June, Indiana left in July, Georgia and North Dakota left in August and Florida left in September. In Florida in 2013, a furor erupted when only 27 percent of fourth-graders passed the PARCC writing test. The state Board of Education promptly, and retroactively, lowered the score required to pass the test - and in a flash, the pass rate jumped to 81 percent. So much for the magic of high stakes tests!

In 2014, Oklahoma left in January, Kentucky left in March, Florida left in May, Arizona, Louisiana and Tennessee left in June, New York made “special arrangements” in July. In New York, after two years of public outrage over the PARCC test (that only had about a 33% pass rate), the State legislature voted to delay the consequences of the Common Core test and to set up a different State controlled test.

All of the above revolts meant that by the August 2014 deadline to pay Pearson for the 2015 PARCC test, only 10 States were left: AR, CO, IL, MD, MA, NJ, NM, OH, and RI. Mississippi withdrew from PARCC in January 2015 and will soon be out of Common Core. Delaware and New Hampshire are now both SBAC States. Indiana, Oklahoma Louisiana and South Carolina have repealed the Common Core standards altogether. In New Jersey, a bill that would slow down the introduction of the Common Core education standards and the use of test scores in teacher evaluations passed the Assembly Education Committee with unanimous support. So it is likely New Jersey will shortly be out of PARCC. This would drop the number of PARCC States down to 8. The PARCC contract in New Mexico is also in dispute after a Pearson connected “bidding scandal.” If this lawsuit succeeds, PARCC/Pearson would be down to 7 States. Massachusetts has put PARCC on hold with a 2 year phase in. This would drop PARCC to only 6 States. In July 2015, Ohio pulled out of PARCC meaning PARCC may soon be down to only 5 states.

SBAC Test also losing States like Rats leaving a Sinking Ship
In 2010, SBAC started with 31 states, 17 of which were designated as governing states. As of July 21, 2014, SBAC still lists 22 states on its website. Unlike PARCC, SBAC appears to still be above the 15-state mark for federal funding. However, if it loses one or two more states in will fall below this crucial mark. According to the SBAC website, the 17 governing States are: CA, CT, DE, HI, ID, ME, MI, MT, NV, NH, ND, OR, SD, VT, WA, WV, and WI. The 3 remaining affiliated Members are IA, NC and WY. This would indicate that SBAC still has 20 States. The map incorrectly shows Missouri. But they are developing their own test for 2016.

In 2012, Utah withdrew from SBAC. In 2013, Pennsylvania opted out in favor of its own test. In December 2013, Kansas jumped ship. Missouri defunded Common Core testing in favor of their own State test. Wyoming joined SBAC in late 2010. However, it has decided to not sign the SBAC agreement and will not administer the SBAC test in 2015. So they are effectively opting out. In August 2014, Iowa also withdrew from SBAC. This brings SBAC down to the following 18 States: CA, CT, DE, HI, ID, ME, MI, MT, NV, NC, NH, ND, OR, SD, VT, WA, WV, and WI. Since then, North Carolina and Michigan pulled out of SBAC and moved to their own STATE tests dropping the SBAC total to 16 states. Then in June 2015, Maine pulled out of SBAC dropping the total SBAC states to 15.

Combined with the 7 States still actively in PARCC, there will be about 22 States giving the SBAC and PARCC tests in 2016.

Here are a couple of websites trying to keep track of all of these changes:
http://www.realcleareducation.com/articles/2014/12/09/common_core_future_elections_heat_map_1140.html#map

http://media.cleveland.com/plain_dealer_metro/other/Test%20roundup%20from%20Education%20Commission%20of%20the%20states.pdf

After all of these changes, here is a map of where things likely stand as of July 2015:

02

Below is a table summarizing all of these changes for States A through M.

03
Below is a table summarizing all of these changes for States N through Z.

04

Test option key:
SBAC Computer only CC test
PARCC Computer or Paper CC test
ACT Aspire test
AAI Achievement Assessment Institute Univeristy of Kansas
AIR American Institute for Research
PREP Pearson's Ridiculously Expensive Program
STATE State Designed and Administered Test
RFP Request for Proposal. Trying to decide what test to use next.

Opposition from Parents and Teachers Drives the Rebellion
Ohio is a good example of why states are opting out of the Common Core tests. A poll of parents and teachers taken after the 2015 Common Core PARCC test found overwhelming opposition to the test. Specifically, over 90% of parents and teachers oppose the massive amount of time Common Core tests take away from actual learning. Here are the results of a recent Ohio poll:

Teachers: Do you think the time that was required to administer the new PARCC assessments (ELA and math) was appropriate?

05
Parents: Do you think the time that was required to administer the new PARCC assessments (ELA and math) was appropriate?

06On July 1, 2015, the Washington State Superintendent of Public Instruction announced that more than 50,000 Juniors had failed the SBAC math test – despite the fact that Washington students are among the highest achieving students in the world on both national and international math tests!

The Central Committees of both the Washington State Republican and Democratic Party have already passed resolutions by overwhelming margins opposing Common Core and the SBAC test. The only question left is if the Washington state legislature will wake up and jump ship before the SBAC test boat sinks completely.

End the Struggling Student Shell Game

Raising the Graduation Rate Starts by Counting Every Student. In this report, we provide evidence that some school districts are not telling the truth about their graduation rate. They are misleading the public with exaggerated claims of amazing increases in the graduation rate when the evidence shows that there has been no dramatic increase in the graduation rate either of individual school districts or Washington state as a whole. Instead, some school districts have artificially increased their graduation rate by taking advantage of a loophole in the graduation rate formula that allows them to not include struggling students in their school district. We propose that this loophole be closed and that OSPI and school districts count every student to determine the true high school graduation rate in each school district.

The High School Graduation Rate in Washington State has not increased in several years
Go to the Washington State OSPI website and click on Research, then School Report Card. While it opens to a page that claims to be about the Class of 2015, the 4 year statewide graduation rate is about the class of 2014 and is listed as 77%. Select the Previous year and click Go and you will see that the statewide graduation rate for the Class of 2013 was 76%. The Class of 2012 was 77% and the Class of 2011 was 77%. Put bluntly, there has not been a significant improvement in the graduation rate here in Washington state in several years. Here is the direct link:
http://reportcard.ospi.k12.wa.us/summary.aspx?groupLevel=District&schoolId=1&reportLevel=State&year=2014-15

01

The Reason the High School Graduation Rate has not increased is that the State legislature has gutted funding for public schools – preventing struggling high school students from getting the help they need to complete their courses
The lack of progress in improving the graduation rate in Washington state is understandable given that our state legislature has gutted funding for public schools during the past 20 years in order to give billions in tax breaks to Boeing, Microsoft and other wealthy multinational corporations.

The low graduation rate in Washington state is not the fault of students, teachers, parents, schools or school districts. It is the fault of a state legislature that is so corrupt that it is essentially owned by wealthy multinational corporations and cares more about giving tax breaks to the rich than funding our public schools.

02

As a result of massive tax breaks to wealthy corporations, Washington state now has among the lowest school funding in the nation as a percent of income and among the highest class sizes in the nation. For Grades 1 through 6, the national average class size is 21 students and the average class size in Washington state is 24 students.

03
For Grades 7 through 12, the national average class size is 27 students and the average class size in Washington state is 30 students.http://nces.ed.gov/programs/digest/d13/tables/dt13_209.30.asp

04

It is impossible to increase the graduation rate when class sizes are so large that struggling students do not get the help they need to complete their courses.

05

This is why the Washington State Supreme Court has ruled that the State legislature is in “contempt of court.” It is contrary to our state constitution for the legislature to rob billions of dollars from our public schools in order to line the pockets of the corporations and billionaires that paid for their elections.

06

Despite the fact that the graduation rate in our state has not improved in several years, some school district administrators in Washington state have recently claimed that they have miraculously raised the graduation rate in their school district.

For example, on December 10, 2015, administrators of the Tacoma School District announced that they had raised their graduation rate from a 55% for the Class of 2010 to an amazing 82.6% - an increase of 27% in just 5 years! http://www.tacoma.k12.wa.us/Pages/default.aspx

Sadly, while it would be wonderful if more students were graduating from the Tacoma School district, OSPI actual enrollment and graduation reports show that there has been no increase in the graduation rate in the Tacoma school district! Instead, like several other school districts (but not all school districts), the Tacoma School District has used a series of reporting scams to hide struggling students from their OSPI Graduation reports in order to artificially inflate the graduation rate in their school district. Because the Devil is in the Details, let's look more closely at how these cheating school districts are misleading the public.

Greatly Under Reporting the Number of 9th Graders
The on time graduation rate should be simple to determine. Just take the number of graduates in any given year and divide it by the number of 9th graders who started high school 4 years earlier. The latest graduating class analysis posted at OSPI is for the Class of 2014 so we will use that class for our analysis. The graduating class of 2014 were Seniors in the fall of 2013, Juniors in the fall of 2012, Sophomores in the fall of 2011 and 9th graders in the fall of 2010.


How OSPI Hides 9th Graders
We noted above that the OSPI Statewide Report Card for the past 4 years shows an on time graduation rate of about 77%. However, these graduation rates were based on an average claimed 9th grade cohort of about 79,000 students. The actual 9th grade cohort as averages about 86,000 students meaning that about 7,000 students per year or almost one in ten high school students has somehow been "hidden" and is not being reported!


Year – Class of

Actual # of

Graduates

Claimed 9th Grade Cohort

Reported Graduation Rate

Actual 9th Grade Cohort

Actual Graduation

Rate

2011

61,550

81,680

77

88,232

70

2012

60,345

78,458

77

86,576

70

2013

60,170

79,528

76

86,382

70

2014

60,680

78,556

77

84,868

71


Sources: Number of Graduates and Claimed Cohort from OSPI Annual Graduation Reports; Actual 9
th Grade Cohort per OSPI 1251 enrollment reports...Class of 2014 = 2010 Report, Class of 2013 = 2009 Report, Class of 2012 = 2008 Report, Class of 2011 = 2007 Report

How are these 7,000 students per year being hidden and not counted? To see how this is done, we will look at a series of school districts beginning with the worst student hiding school district - the Tacoma School District.


How the Tacoma School District Hides 9th Graders
In October 2010, according to OSPI report 1051, there were 2,707 9th graders attending school in the Tacoma School District. http://www.k12.wa.us/safs/rep/enr/1011/s1251.pdf

The Tacoma school district website enrollment for October 2010 listed 2,678 9th graders in October 2010 for a difference of only 31 students. In June 2014, according to the OSPI latest report, 1,464 students graduated from the Tacoma School District. This makes the on time graduation rate in the Tacoma School District 1464 graduates /2707 9th graders = 54%. Using the school district enrollment of 2,678, the graduation rate was 1464/2678 = 55%. In other words, the actual graduation rate in the Tacoma School District in 2014 was only 54% to 55% - the same as it was in 2010!

Yet in December 2014, the Tacoma School District issued a press release claiming that the graduation rate in the Tacoma School District was 78%. How did they get from an actual rate of 55% to a reported rate of 78%? To see how this is done, go to the OSPI website and click on Research, then Data and Reports, then Dropout and Graduation. Here is the direct link to this OSPI page:
http://k12.wa.us/DataAdmin/default.aspx#dropoutgrad

You will see several confusing reports for each year:

07

What we want is the most recent school district reports. This is 2013-14 Appendix C District Adjusted 4 year. Click on the link to download the Excel spreadsheet. Then open the spreadsheet and scroll down the page to the Tacoma School District. Here is what you will see:

08

Note that the Tacoma School District administrators claim that only 1887 students began the 9th grade in the Tacoma School District in 2010! This is over 800 students less than were listed on the 9th grade OSPI attendance report in October 2011. After adjusting for 17 more transfer outs versus transfer ins and the adjusted claimed 9th grade cohort dropped down to only 1870 students. 1464 students graduated and thus the claimed graduation rate was 1464/1870 = 78%.

Sadly, the Tacoma School District is not the only school district using this reporting scam to artificially inflate their graduation rates. Seven of the 20 largest school districts under reported the number of 9th graders on the 2013-2014 OSPI graduation report by more than 10% of the actual total. The least honest school district was Tacoma which under reported the number of 9th graders by 27%. The next least honest was Kent at 24%. Seattle and Renton tied for third least honest at 18%. Below is a comparison of the 30 largest school districts of number 9th graders on OSPI report for 2010 versus 2014 graduation report.

09
Sources: Actual 9th Graders from OSPI Report 1251 (2011). Rest of data from OSPI Graduation Report 2013 2014 Appendix C. Pasco and Richland excluded due to reporting errors.

On a positive note, 80% of the 40 largest school districts reported close to their actual number of 9th graders.

Below is a graph of the difference between the reported graduation rate and the actual graduation rate for the four least honest school districts:

10

The Struggling Student Shell Game
Now that we understand that only some school districts are hiding students, we will take a closer look at how this struggling student shell game works. In conversations with OSPI administrators about this problem, they dismissed it by claiming that the Tacoma School District simply had a "high mobility rate." The problem with this claim is that the 2014 OSPI Graduation Report confirms that the Tacoma School District only had 17 more students transfer out than transfer in. So mobility only accounts for 17 students out of the missing 722 students. Where did the other 700 Tacoma School District 9th graders go?

The answer is that they went to "Alternative Learning Experience (ALE) Programs" - mainly the K12 INC online program ran by the Quilcene School District in Forks Washington. These ALE programs are being used by several school districts to hide struggling students and "get them off of the school district book." Once these struggling students transfer to another school district, they are no longer counted as part of the Tacoma School District Cohort. But also, they are not counted as part of the Quilcene School District Cohort because they did not start the 9th grade in the Quilcene School District. These struggling students become invisible - even though all of them are still living in the Tacoma School District! Even the office for the Quilcene K12 INC online program is located in Tacoma! The graduation rate for the K12 INC program is only 30%. But it is not counted in any way as a part of the Tacoma School District graduation rate or even the Washington State Graduation rate. The kids are invisible due to a "loophole" in the State Graduation Rate formula that not only allows this scam but encourages it

How the Struggling Student Shell Game was Created
Here is the language in from the OSPI Report Card website used to justify the struggling student shell game:

"Actual Adjusted 4-Year (On-Time) Cohort Graduation Rate (Class of 2013) – The total number of students identified in grade 9 as belonging to the Class of 2013 (during the 2009-10 school year) who are reported as graduates, divided by the total number of students identified as the Class of 2013, during the 2012-13 school year. Students who enrolled at any time prior to the end of the 2012-13 school year, identified as belonging to the Class of 2013, are included in the calculations. Students identified as belonging to the Class of 2013 who have exited with a confirmed transfer... are removed from the calculations. "

The loophole is "exited with a confirmed transfer." What it really should say is "confirmed to have moved out of the school district." Otherwise transfers can and do occur to ALE programs even when the student remains in the school district.

Here is what the federal law actually says:
"As defined in 34 C.F.R. §200.19(b)(1)(i)-(iv), the four-year adjusted cohort graduation rate (hereafter referred to as “the four-year graduation rate”) is the number of students who graduate in four years with a regular high school diploma divided by the number of students who form the adjusted cohort for the graduating class. From the beginning of 9th grade, students who are entering that grade for the first time form a cohort that is subsequently “adjusted” by adding any students who transfer into the cohort later during the 9th grade and the next three years and subtracting any students who transfer out, emigrate to another country, or die during that same period."

More information about the actual adjusted cohort calculations can be found at http://www2.ed.gov/policy/elsec/guid/hsgrguidance.pdf.

The above report goes on to explain that the graduation rate must include ALL students in the 9th grade cohort, even including special education students.

See the difference? Federal law refers to transfers as in students transferring out of the school district or out of the state while OSPI merely refers to "exited with a confirmed transfer" which OSPI and the Tacoma School District have interpreted to mean transferring to an ALE program in another school district even if the student continues to legally reside in the same school.

Federal law is not written in terms of school districts but simply in terms of "schools." One might therefore argue that when a student changes from the Tacoma School District to the K12 INC program in the Quilcene School District that they are no longer in the Tacoma School District and should be counted against the graduation rate in the Quilcene School District. In fact, such students are not counted in the Graduation Rate for either school district. Also in fact, the students still live legally in the Tacoma School District. Even the K12 INC head office is in the Tacoma School District. The intent of the federal law was a complete and accurate accounting of all students. Therefore the OSPI interpretation and the loophole it creates are something being done by OSPI not by any federal regulation. The above report makes it clear that every student should be counted. Washington law reports graduation rates by school district. Every student in every school district should be accurately counted in terms of where they actually live.

What about the section of federal law that allows for transfers to include transfers to "other programs?"
The above report explains that students may be considered to have transferred out (of the school or school district) if the student transfers to a private school or a home school program or to "other educational programs" that lead to a high school diploma. But the report also makes clear that the state record keeping must be complete and accurate. It is not appropriate for OSPI to create a black hole where 7,000 students per year are simply not counted in order to artificially increase the graduation rate in a particular school district or the state as a whole. OSPI record keeping is neither complete or accurate.

Red Flags Ignored by OSPI...
There have been several red flags ignored by OSPI. Here are a couple.

Major Declines in Middle School and Elementary School Enrollment
There are a series of "red flags" that should have been a clue to OSPI that some sort of scam was occurring in the Tacoma School district. For example, some school districts such as the Tacoma School District have substantially fewer students in each grade in high school than they do in middle school or elementary school. This should not be the case and questions need to be asked but were not about where all of these students went.

Major Declines in High School Enrollment over Time
Another major red flag is a decline in the school district high school enrollment over time. The total enrollment of students in Washington state is going up slightly over time. So one has to ask why the enrollment would decline in any given school district. Below is the number of 9th graders in the Tacoma School District from 2010 to 2015 October enrollments per OSPI Report 1251.

11

Something major happened in the Tacoma School District between 2012 and 2013 because there has been a huge unexplained decline in high school enrollment of about 700 students per grade since 2012. Where did these 700 students per year go?

Starting Up Special Programs to use as Dumping Grounds for Struggling Kids?
Some claim that special programs such as the Willie Stewart Academy, which opened during the 2013-14 school year, artificially pump up graduation rates by moving some of Tacoma’s most struggling students out of mainstream schools into programs not counted by OSPI. Willie Stewart Academy has a total of about 200 students. To better evaluate this claim, go to the OSPI report card and select the Tacoma School District. Then select the Willie Stewart Academy. You will see that it was closed on July 31 2015. Before that, it has an enrollment of 200 students and a graduation rate of 2 percent. No wonder it was closed. Tacoma also has the Fresh Start program with 200 students and a graduation rate of 15%. They also had a GED program which closed in July of 2015 which had 42 students but did not appear to have any graduates. There is also Oakland high school with 200 students and a graduation rate of 15%. So there appears to be several programs that are used as dumping grounds for struggling students in Tacoma. It is not clear how many of these programs are counted in Tacoma's graduation rate.

12

Why the Washington State Graduation Rate is about to Decline Dramatically
Not only has the state legislature refused to fully fund our public schools, but they have been quietly increase the graduation requirements during the past several years. First, they have increased the number of credits needed to graduate from 19 credits to 24 credits. This means that in many school district, any student who fails even a single class during their four years of high school will not be able to graduate. Second, some requirements have been raised dramatically. Some students will be required to take four years of advanced math courses to graduate. Third, the new SBAC tests are extremely unfair with only 20% to 30% of students able to pass these tests that will be required for graduation beginning with the class of 2017. As many as 50,000 students per year may be denied a high school diploma simply because they failed one of these tests that are so difficult that few members of the state legislature could even pass them.

13

What is the solution to the Struggling Student Shell Game?
I have proposed a bill that would continue to count every student in every school district as being part of the grade cohort for that school district unless and until the student physically moves out of the school district and into another school district. We will keep you posted as to whether this bill actually gets a hearing.

Here is the text of our bill, called the Accurate High School Graduation Rate Act of 2016:

AN ACT Relating to improving the completeness and accuracy of graduation rate reports; amending RCW 28A.175.010; and creating new sections.

BE IT ENACTED BY THE LEGISLATURE OF THE STATE OF WASHINGTON:

NEW SECTION. Sec. 1. The legislature finds that:

(a) There is a loophole in current Washington State law that results in thousands of students not being counted in the graduation rates of schools and school districts after having transferred to "Alternative Learning Experiences" even though these students still reside in the school district which no longer counts them.

(b) These students also might not be counted by the receiving school district.

(c) Many of the Alternative Learning Experience programs have an extremely low graduation rate... a rate that is often only half of the state average graduation rate.

(d) Parents and concerned citizens are mis-informed by not being provided with an accurate and complete graduation rate for their school district.

(e) Parents and concerned citizens are also mis-informed by not being provided with an accurate and complete graduation rate for alternative learning experiences.

(f) Schools and school districts currently have an incentive to push struggling students into alternative learning experiences in order to artificially inflate their published graduation rates.

(g) The legislature therefore intends to provide clarifying language to make it clear that every school district must count every student and to remove the incentive for school districts to dump struggling students into alternative learning experience programs.

Sec. 2. RCW 28A.175.010 is amended to read as follows:

Educational progress information—Reporting requirements—Rules—Reports to legislature—Annual estimate of savings.

Each school district shall account for the educational progress of each of its students. To achieve this, school districts shall be required to report annually to the superintendent of public instruction:

(1) For students enrolled in each of a school district's high school programs:

(a) The number of students who graduate in fewer than four years;

(b) The number of students who graduate in four years;

(c) The number of students who remain in school for more than four years but who eventually graduate and the number of students who remain in school for more than four years but do not graduate;

(d) The number of students who transfer to other schools outside of the school district. Students who enroll in alternative learning experiences in or out of a school district but continue to legally reside in the school district shall continue to be counted as part of the school district and school district grade cohort for purposes of determining the on time and extended graduation rates ;

(e) The number of students in the ninth through twelfth grade who drop out of school over a four-year period; and

(f) The number of students whose status is unknown.

(2) Dropout rates of students in each of the grades seven through twelve.

(3) Dropout rates for student populations in each of the grades seven through twelve by:

(a) Ethnicity;

(b) Gender;

(c) Socioeconomic status;

(d) Disability status; and

(e) Identified homeless status.

(4) The causes or reasons, or both, attributed to students for having dropped out of school in grades seven through twelve.

(5) The superintendent of public instruction shall adopt rules under chapter 34.05 RCW to assure uniformity in the information districts are required to report under subsections (1) through (4) of this section. In developing rules, the superintendent of public instruction shall consult with school districts, including administrative and counseling personnel, with regard to the methods through which information is to be collected and reported in a manner which is complete, accurate and accounts for each and every student.

(6) In reporting on the causes or reasons, or both, attributed to students for having dropped out of school, school building officials shall, to the extent reasonably practical, obtain such information directly from students. In lieu of obtaining such information directly from students, building principals and counselors shall identify the causes or reasons, or both, based on their professional judgment.

(7) The superintendent of public instruction shall report annually to the legislature the information collected under subsections (1) through (4) of this section.

(8) The Washington state institute for public policy shall calculate an annual estimate of the savings resulting from any change compared to the prior school year in the extended graduation rate. The superintendent shall include the estimate from the institute in an appendix of the report required under subsection (7) of this section, beginning with the 2010 report.

Conclusion... We Must End the Struggling Student Shell Game
What is clear is from this report is that there is no turn around miracle going on in the Tacoma School District or any other school district in Washington state. Students need more than pep talks and toxic high stakes tests. Struggling students need small class sizes beginning in the early grades so that they can get the help they need from experienced teachers. It would take more than $3 billion per year in additional state funding just to lower class sizes in Washington state back down to the national average. The only bill that has been introduced into the legislature that would provide this $3 billion per year is Senate Bill 6093 – which would repeal a tax break used by billionaires to avoid paying their fair share of state taxes. So far, this bill has not even gotten a hearing.

14

So what is the solution to the lack of school funding in Washington state?
We cannot solve the school funding problem by constantly re-electing the same corrupt people who created the problem. It will either take more action by the Supreme Court or it will take parents and teachers willing to run for office and replace the current batch of people in Olympia with a different group of people that will actually take their paramount duty to fund the public schools seriously. Only then will we see a real reduction in class sizes and a real increase in the high school graduation rate here in Washington state.

As always, I welcome your questions and comments.

Regards,
David Spring M. Ed.
This email address is being protected from spambots. You need JavaScript enabled to view it.
Coalition to Protect our Public Schools (dot) org.

Bill Gates Education Speech Proves He is Completely Detached from Reality

On Wednesday October 7 2015, Bill Gates gave the Key Note address at a US Education Learning Forum in Bellevue Washington. Considering that Bill is the richest man in the world, his numerous mis-statement of the facts during this speech was truly frightening. In this article, we will examine only a few of the most glaring distortions of the truth. Here is a link to his speech as posted on the Gates Foundation website for those who want to read the whole thing. http://www.gatesfoundation.org/Media-Center/Speeches/2015/10/Remarks-at-USP-Education-Learning-Forum

Fact #1: How many states are still using Bill's poorly written and age inappropriate Common Core standards – paid for by Bill and written by a couple of Wall Street consultants?

Here is Bill Gates: “Today 42 states and the District of Columbia are using the Common Core State Standards.”

Here is reality: States were blackmailed to adopt the Common Core standards before they were even finalized by Arne Duncan. Almost half of these states abandoned the Common Core standards as quickly as they could. Currently only about 20 states still use the Common Core standards. Can it be that Bill Gates really does not know this???

01

For more information on the states that withdrew from Common Core and their current status, see the following web page:
http://weaponsofmassdeception.org/2-common-core-fake-standards/2-4-support-for-common-core-plunges

Bill's copyrighted standards were so poorly written that hundreds of child development experts from across the nation submitted a statement opposing them as being “developmentally inappropriate.” More than 500 early childhood professionals signed a statement opposing Common Core. The Joint Statement of Early Childhood Health and Education Professionals on the Common Core Standards Initiative was signed by educators, pediatricians, developmental psychologists, and researchers, including many of the most prominent members of those fields. Their statement reads in part: “We have grave concerns about the core standards for young children…. The proposed standards conflict with compelling new research in cognitive science, neuroscience, child development, and early childhood education about how young children learn, what they need to learn, and how best to teach them in kindergarten and the early grades….”
http://weaponsofmassdeception.org/2-common-core-fake-standards/2-2-common-core-standards-are-not-age-appropriate

Bill's rigid Common Core standards which try to place every student in the nation in the same box, as if our kids were robots, is so opposed by parents and teachers that even in Bill's home state of Washington, both the Republican and Democratic parties overwhelmingly passed resolutions opposing Common Core and Common Core tests. When both political parties agree that Common Core is a disaster, it will not be long until it goes the way of the dinosaur.
http://weaponsofmassdeception.org/8-options-for-real-education-reform/8-3-how-to-get-your-state-party-to-oppose-common-core

Fact #2: The Myth of the Super Teacher versus Smaller Class Sizes. Years of research has shown that lower class sizes are how teachers are best able to help struggling students. But throughout his speech, not once did Bill Gates mention the role of smaller class sizes. Instead, nearly his entire speech was based on the Myth of the Super Teacher.

Here is a quote from Bill Gates: “Here’s the problem: Too often, teachers have to move up on their own. They don’t get the feedback or tools they need to improve their practice. So they move up slowly. That’s not only a loss for their students; it’s frustrating for the teachers. The work we are doing with all of you is intended to help every teacher move up the learning line, faster and in concert with their colleagues, so that no one gets stuck trying to fight their way up alone.”

Here is reality: Nearly every one of Bill's pet projects, from Charter Schools to Teacher for America has been an attack on teachers. How charter schools increase their profits is by gutting teacher pay. Charter schools pay their teachers about half of what public schools pay their teachers. As for the fake teacher training program called Teach for America, does Bill Gates or anyone on the planet truly believe that the best way to have high quality teachers is to give them only 5 weeks of training before throwing them into a classroom of students???

02

Fact #3: There is no single measure of a great teacher because teachers like students are diverse.
Bill would like us to believe that we can assign a number to every teacher and every student to tell the good ones from the bad ones. Humans however are much more complex than any computer program.

Here is Bill Gates: “A growing body of evidence told us that teacher effectiveness is the single most important in-school factor in student achievement. If you take two classrooms from the same school, both starting out at the 50th percentile, and assign one to a teacher in the top quartile and another to a teacher in the bottom quartile, there will be a 10 percentile difference in achievement at the end of the year.”

Here is reality: Student test scores are not a measure of either student learning or teacher effectiveness. Numerous studies have shown that a teacher who is in the top quartile one year is likely to be in the middle of even bottom quartile the next year.

More than 80 studies have been done on using the VAM method to evaluate teachers. They all found that VAM is not a consistent or reliable way to measure teacher performance. Here is a link to a list of these studies. http://vamboozled.com/recommended-reading/value-added-models/

For example, in 2013, Edward Haertel, a Stanford University researcher, published a detailed report on the lack of reliability of using student test scores to evaluate teachers. http://www.ets.org/Media/Research/pdf/PICANG14.pdf

He concluded that VAM scores were worse than bad. Here is a quote from page 23 of his study: “My first conclusion should come as no surprise: Teacher VAM scores should emphatically not be included as a substantial factor with a fixed weight in consequential teacher personnel decisions. The information they provide is simply not good enough to use in that way. It is not just that the information is noisy. Much more serious is the fact that the scores may be systematically biased for some teachers and against others...High-stakes uses of teacher VAM scores could easily have additional negative consequences for children’s education. These include increased pressure to teach to the test, more competition and less cooperation among the teachers within a school, and resentment or avoidance of students who do not score well. In the most successful schools, teachers work together effectively. If teachers are placed in competition with one another for bonuses or even future employment, their collaborative arrangements for the benefit of individual students as well as the supportive peer and mentoring relationships that help beginning teachers learn to teach better may suffer.”


The claim by Bill Gates that a great teacher can magically improve student scores by 10% is about as accurate as his claim that 42 states are still using the Common Core standards. What studies have shown is that lower class sizes so teachers can help struggling students is the best way to raise student achievement. But lowering class sizes would require Bill Gates to start paying his fair share of state taxes so instead Bill prefers to focus on “magic bullet solutions like finding the perfect teacher.

Fact #4: Green Dot charter schools do not excel at supporting teachers and are not a good model for public schools.
Green Dot charter schools make a massive profit for their corporate masters. But they condemn both teachers and students to hell on earth.

Here is a quote from Bill Gates: “In Los Angeles, the Green Dot charter schools have college readiness rates that are almost four times higher than district-run schools with similar students…So we studied what they all have in common. It turns out that they excel at supporting teachers.”

Here is the reality of the Green Dot charter schools: A high percentage of the schools close after just a few years. Pressure on teachers is so intense that over half of the teachers quit within two years. Most teachers at Green Dot are TFA teachers with only 5 weeks of training. Most students either quit or are driven out of Green Dot for low performance. Out of a cohort of 90 6th Graders, there may be less than 20 left by the 11th grade. Of these 20, a high percent do graduate and some even go on to college. But of the entire cohort of 90 students, Green Dot schools perform far worse than comparable public schools. Here is a link to the horrors of Green Dot schools written by a former Green Dot teacher in 2013.
http://dianeravitch.net/2013/06/05/the-inside-story-of-the-green-dot-charter-schools/

Here is a quote from this article: “I began to question the effectiveness of the Green Dot model after the first year, when over 30% of the teachers resigned. By my second year of teaching for Green Dot, both of the administrators whom hired me had to resign, as had the dean of the school. At the end of the first semester of my second year, another 30% of the teachers had left. There is little to no encouragement, nothing done to help a teacher’s self-esteem, only the constant chorus of “you can improve. It’s both troubling and distressing to see so many aspiring, young teachers cast away their hopes of making a difference by being evaluated as ineffective, or even as clueless, and then led on the path of termination. To me, this is the most significant failure of the Green Dot model, its inability to retain and train teachers to become effective in the classroom.”

Even former TFA teachers know that TFA is a scam. So why hasn't Bill Gates learned this lesson?

03
Given the massive attrition rate of Green Dot teachers and students, for Bill Gates to claim that Green Dot is successful because it supports teachers is simply absurd.

Fact #5: The US is not ranked in 14th place on international reading tests.
It is common for people who have not done the slightest research to repeat the false claim that US students do poorly on international tests. In fact, adjusted for poverty, US students are among the highest performing students in the world.

Here is a misinformed quote from Bill Gates: “Consider where the U.S. ranks internationally on reading proficiency: We’re in fourteenth place. “

Here is reality: Students from high income families do better on international tests than students from low income families. Many nations “rig” their international tests but only having high income students take the tests. Other nations that do well on international tests (like Finland) do not have many low income students. The US has all of their students take international tests. The US also has one of the highest poverty rates in the world. Two of the three major international tests—the Progress in International Reading Literacy Study and the Trends in International Math and Science Study—break down student scores according to the poverty rate in each school. The tests are given every five years. The most recent results (2006) showed that students in U.S. schools where the poverty rate was less than 10 percent ranked first in the world in reading, first in science, and third in math. When the poverty rate was 10 percent to 25 percent, U.S. students still ranked first in reading and science. 
http://phys.org/news/2013-01-poor-international-student.html

In 2013, Martin Carnoy with the Stanford Graduate School of Education and Richard Rothstein with the Economic Policy Institute produced a highly detailed study breaking down how different income levels of students would perform in the United States on various international tests. Here is the citation and link to this important 99 page study: Carnoy, Martin & Rothstein, Richard (January 2013) What Do International Tests Really Show About U.S. Student Performance? Economic Policy Institute, Washington DC. http://s2.epi.org/files/2013/EPI-What-do-international-tests-really-show-about-US-student-performance.pdf

The authors provided extensive data confirming that “If U.S. adolescents had a social class distribution that was similar to the distribution in countries to which the United States is frequently compared, average reading scores in the United States would be higher than average reading scores in the similar post-industrial countries we examined (France, Germany, and the United Kingdom).


The reason US students as a whole score poorly is because of the high rate of poverty in the US. The high rate of poverty is caused by the concentration of wealth in the hands of a few billionaires in the United States. Sadly, despite being the richest man in the world, Bill Gates refuses to pay his fair share of state and federal taxes. If we could get Bill to take some responsibility and pay some taxes, we could hire tens of thousands of teachers who could give struggling low income students the help they need to succeed. Bill Gates literally is the cause of the problem he is now complaining about.

Fact #6: Forcing all students into the Common Core mold does not respect the diverse ways that students learn.
We have known for a long time that students learn at different rates and have different learning styles, and different interests. A serious flaw of Common Core is that it expects all students to learn the same skills at the same time and in the same way. It ignores the research about child differences.

Here is a quote from Bill Gates: “All students deserve the opportunity to learn in a way that is tailored to their needs, skills, and interests.”

Here is the reality of the Common Core Straight Jacket Approach to Education: The focus of Common Core is on teaching to the test and very convergent learning styles promoting low level learning which is little more than repeating back what the student was told. No diversity is allowed. No room for differences in learning styles or differences of opinion. It is more like a military boot camp or brain washing approach to education rather than training to be an active participant in our democracy.

04

Fact #7: What we have here is a failure to do research on child development.
Bill Gates clearly is clueless about either teaching or child development or public schools.


Here is a final quote from Bill Gates: “What we have is a failure to communicate… We need to figure out how to get the practices that are gaining success in one school, district, or state to be adopted in many others… If you’re a governor or state chief, I urge you to take a hard look at whether your system is giving teachers the support they need.

Here is reality: The reason we have a failure to communicate is because Bill Gates refuses to listen and refuses to do any research on child development. Instead he surrounds himself with “Yes” men, charlatans, hucksters and con artists – all of whom take advantage of Bill's deep ignorance and huge ego.

Here is a quote from a real education leader, Carol Burris, the executive director of the Network for Public Education: "The Gates reforms of Common Core plus testing plus teacher evaluation based on test scores has been a disaster in New York… There's a reason that over 220,000 students opted out of the common-core exams in New York. If you talk to parents in the opt-out movement ... what they say universally is they do not want their teachers evaluated by test scores because they understand that when they are, there's a hyper-focus on teaching to the test."

If Common Core and the Common Core SBAC test are so wonderful, then why hasn't Bill put his own kids in a Common Core school. Bill spends a huge amount of money to send his kids to the best private school in Seattle, a school called Lakeside. Lakeside has no Common Core book or tests, it has no TFA teachers, it has none of the things Bill is trying to push on all of the other schools in the nation. If highly paid teachers and small class sizes are good enough for Bill Gates kids, then our kids should have this same opportunity for small class sizes and highly paid experienced teachers.

In the meantime, we need to end the Bill Gates led Common Core nonsense as soon as possible. The harm it is inflicting on our students must be stopped. Please share this article with any other parents or teachers you know who are concerned about the future of our kids and our schools. As always, we look forward to your questions and comments.

Regards,
David Spring M. Ed.
This email address is being protected from spambots. You need JavaScript enabled to view it.
Coalition to Protect our Public Schools